
Nvidia stock price forecast: China hurdles persist as NVDA trades in volatility band

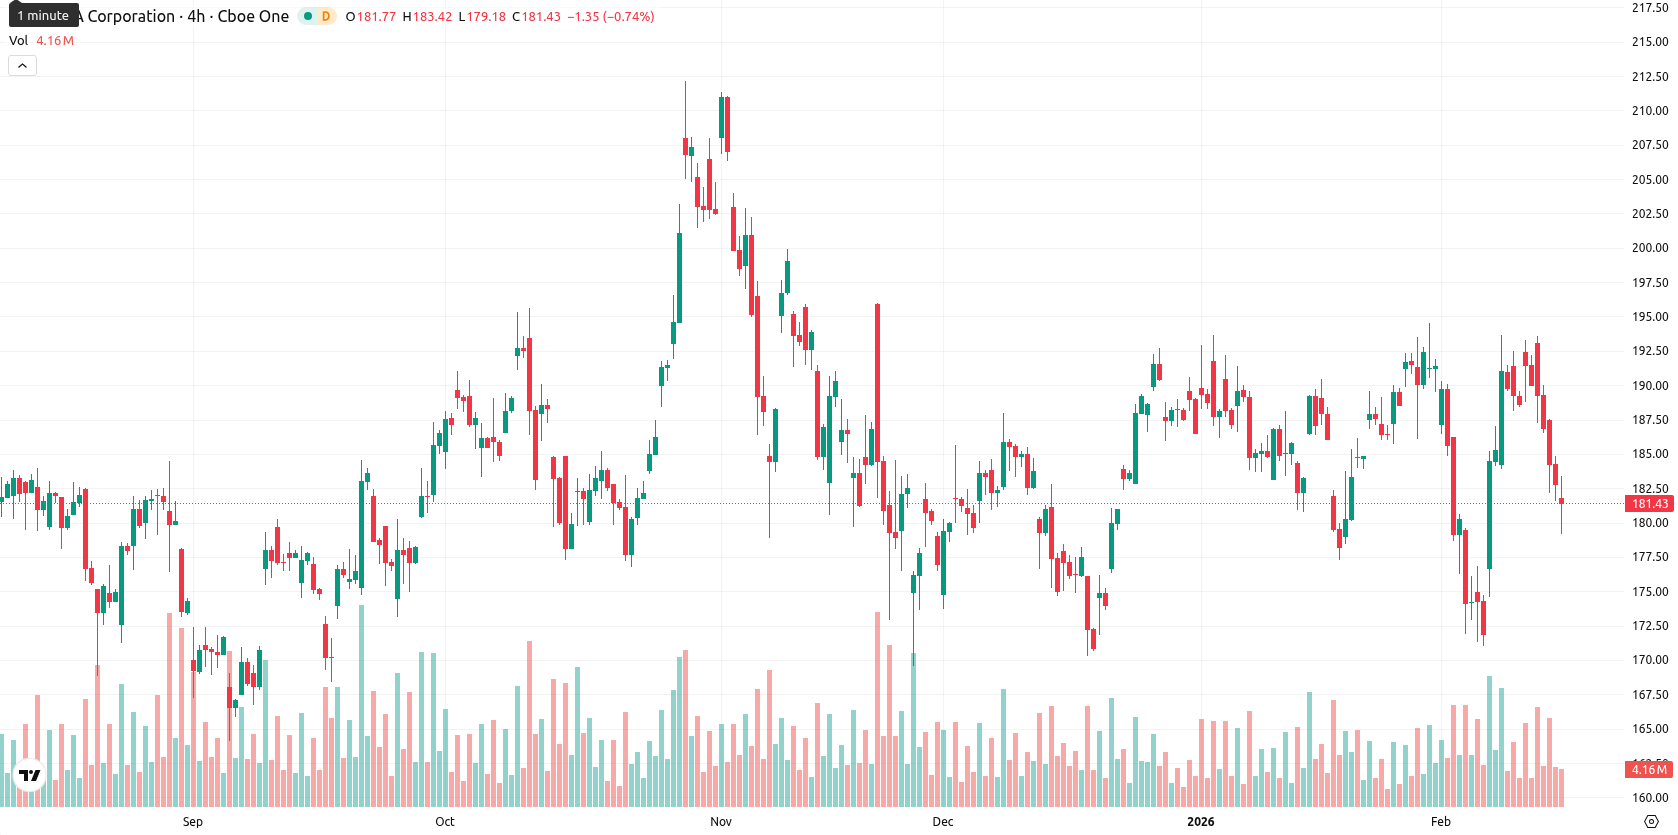
NVIDIA Corporation (NVDA) is trading at $183.62, having advanced 0.44% intraday after opening with a minor gap lower. The share price is below both the MA-20 ($185.33) and MA-50 ($184.41), but remains comfortably above the longer-term MA-200 ($171.67), indicating near-term pressure but supportive long-term momentum.
Highlights
- Nvidia’s H200 chip shipments to China face risks due to ongoing U.S. Department of Commerce restrictions, threatening access to the world’s second-largest AI market.
- Nvidia’s heavy reliance on TSMC for advanced chip production escalates supply chain vulnerability amid rising geopolitical uncertainty in the Taiwan Strait.
- Nvidia shares trade at $183.62 with key support at $182.74 and resistance at $184.41, while short- to medium-term selling pressure persists below MA-20 and MA-50.
Regulatory threat and supply chain risks stress China market outlook
On February 13, Nvidia's position in the Chinese market came under further strain as ongoing U.S. Department of Commerce restrictions affected its H200 chip shipments and broader business operations. The company's ability to supply chips to China hinges on the unstable 'H200 Compromise,' which could be rescinded if downgraded hardware is deemed a security risk, threatening access to the world's second-largest AI market. Additionally, Nvidia's dependence on TSMC for advanced chip manufacturing and memory supply makes it susceptible to geopolitical developments in the Taiwan Strait, creating further supply chain risks.
Technical boundaries hold as momentum indicators diverge
The current technical picture shows NVDA trading below its MA-20 and MA-50, with the longer-term MA-200 at $171.67 offering significant support. The Ichimoku Kijun sets dynamic support at $182.74 and MA-50 at $184.41 serves as resistance. MACD gives a daily buy signal, ADX signals the absence of a strong directional trend, and RSI at 47.3 suggests mild negative momentum. Stochastic RSI and CCI maintain neutral stances, Bull/Bear Power indicates buyers dominate, and the Awesome Oscillator remains neutral, reflecting moderate intraday volatility and resilience after the open.
Range-bound price action likely as bullish drivers strengthen
Over the next five days, NVDA is expected to fluctuate in a typical volatility band between $178.00 and $188.00. There is a 75% probability of an upward move reinforced by strong weekly MACD and moving average signals, while a downward move is less likely. Sideways price action is most probable with $182.74 and $184.41 as key levels; a bullish breakout above $185.00 would depend on renewed buying, whereas a bearish move below $182.74 could see the price test the $180.00 region if short-term selling intensifies.
Previously it was reported that Nvidia is trading just below its short- and medium-term moving averages, reflecting near-term seller pressure and mixed momentum while remaining well above longer-term support. Technical indicators present a range-bound outlook, with moderate probability for upside moves and a trading band established between $179.50 support and $185.00 resistance ahead of the upcoming earnings update.


-
 Afghanistan
-
 Albania
-
 Algeria
-
 Angola
-
 Argentina
-
 Armenia
-
 Australia
-
 Austria
-
 Azerbaijan
-
 Bahamas
-
 Bahrain
-
 Bangladesh
-
 Belarus
-
 Belgium
-
 Bolivia
-
 Botswana
-
 Brazil
-
 Brunei
-
 Bulgaria
-
 Cambodia
-
 Cameroon
-
 Canada
-
 Chile
Chile
-
 China
China
-
 Colombia
-
 Congo
Congo
-
 Costa Rica
-
 Cote d'Ivoire
-
 Croatia
-
 Cuba
Cuba
-
 Cyprus
-
 Czechia
-
 DR Congo
-
 Denmark
-
 Dominican Republic
-
 Ecuador
-
 Egypt
Egypt
-
 El Salvador
-
 Estonia
-
 Eswatini
-
 Ethiopia
-
 Finland
-
 France
-
 Georgia
-
 Germany
-
 Ghana
Ghana
-
 Greece
-
 Haiti
Haiti
-
 Hong Kong
-
 Hungary
-
 India
India
-
 Indonesia
-
 Iran, Islamic republic
-
 Iraq
Iraq
-
 Ireland
-
 Israel
-
 Italy
Italy
-
 Jamaica
-
 Japan
Japan
-
 Jordan
-
 Kazakhstan
-
 Kenya
Kenya
-
 Korea
Korea
-
 Kuwait
-
 Kyrgyzstan
-
 Laos
Laos
-
 Latvia
-
 Lebanon
-
 Lesotho
-
 Libya
Libya
-
 Lithuania
-
 Luxembourg
-
 Madagascar
-
 Malaysia
-
 Malta
Malta
-
 Mauritius
-
 Mexico
-
 Moldova
-
 Mongolia
-
 Montenegro
-
 Morocco
-
 Mozambique
-
 Myanmar
-
 Namibia
-
 Nepal
Nepal
-
 Netherlands
-
 New Zealand
-
 Nigeria
-
 North Macedonia
-
 Norway
-
 Oman
Oman
-
 Pakistan
-
 Palestine
-
 Panama
-
 Papua New Guinea
-
 Paraguay
-
 Peru
Peru
-
 Philippines
-
 Poland
-
 Portugal
-
 Puerto Rico
-
 Qatar
Qatar
-
 Reunion
-
 Romania
-
 Rwanda
-
 Saudi Arabia
-
 Serbia
-
 Singapore
-
 Slovakia
-
 Slovenia
-
 Somalia
-
 South Africa
-
 Spain
Spain
-
 Sri Lanka
-
 Sweden
-
 Switzerland
-
 Syria
Syria
-
 Taiwan
-
 Tajikistan
-
 Tanzania
-
 Thailand
-
 Trinidad and Tobago
-
 Tunisia
-
 Turkey
-
 UAE
UAE
-
 Uganda
-
 Ukraine
-
 United Kingdom
-
United States
-
 Uruguay
-
 Uzbekistan
-
 Venezuela
-
 Vietnam
-
 Yemen
Yemen
-
 Zambia
-
 Zimbabwe
- Forex
- Crypto
