
COST retreats with technicals still favoring upside, supported by robust MACD and ADX signals – weekly report

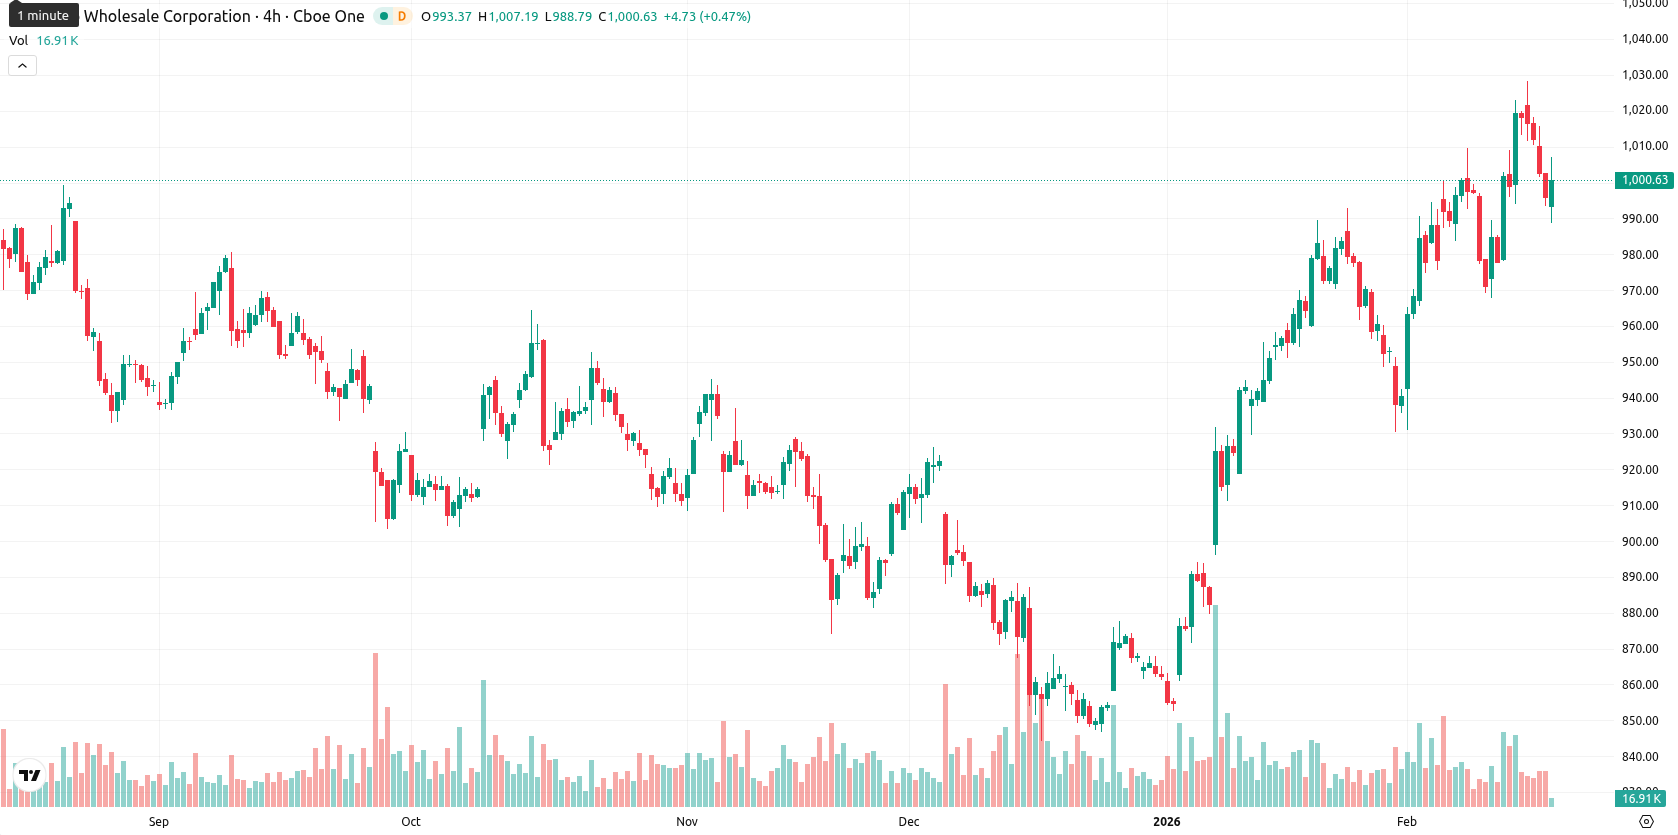
Costco Wholesale Corporation (COST) closed the week at $1,001.89, reflecting a continued bullish momentum with a weekly advance of $5.94, or 0.60%. The stock remains solidly above its weekly MA-20 ($981.58), MA-50 ($927.04), and MA-200 ($951.98), confirming short-term, medium-term, and long-term upward trends.
Highlights
- Costco (COST) trades at $1,001.89, firmly above its 20-, 50-, and 200-day moving averages, confirming sustained bullish momentum across all timeframes.
- Intraday, COST is up 0.60% and shows low volatility near session highs, with market cues pointing toward continued strength and buyer dominance.
- Key support sits at the Ichimoku Kijun $972.72; resistance is near $1,010, with a likely consolidation range of $980–$1,030 and over 80% probability of further gains.
Revenue growth and policy changes drive sentiment amid legal and institutional shifts
Costco reported an 8.3% increase in quarterly revenue year-over-year and recently declared and paid a quarterly dividend, reflecting robust financial performance and shareholder commitment. The company is implementing stricter return policies on high-value goods in response to widespread return fraud, aiming to protect margins while maintaining customer trust. Secondary developments include adjustments in institutional holdings and proposed class-action litigation concerning salmonella exposure at its Nebraska chicken facility.
Bullish technical structure persists as indicators signal upside and caution
On the weekly (W1) chart, COST remains firmly above all key moving averages — MA-20, MA-50, and MA-200 — underpinning an established bullish technical structure. Dynamic support is at the Ichimoku Kijun ($972.72), while immediate resistance is seen at the $1,010 level. Weekly momentum signals support further upside with a strong buy from the MACD and positive trend confirmation on the ADX, but oscillators show mixed signals: weekly RSI remains constructive albeit elevated, and other indicators such as the Bull/Bear Power warn of potential short-term exhaustion. The Awesome Oscillator is neutral on the weekly timeframe.
Sideways consolidation likely this week unless breakout or correction triggers
For the coming week, COST is expected to consolidate between $980 and $1,030, in line with current volatility patterns and technical positioning. The most probable scenario is a sideways movement within this corridor, but a decisive breakout above $1,030 would likely open the way to fresh record highs. Conversely, a weekly close below $972 would increase the risk of a corrective move toward $950. The probability of continued upward movement remains high, supported by sustained W1 bullish signals.
Last time, analysts noted that Costco is trading strongly above its key moving averages, supported by bullish momentum signals from MACD and ADX, while RSI and other oscillators indicate slightly overbought conditions. Immediate support is identified at the Ichimoku Kijun level, with resistance seen near the $1,050 mark amid firm buyer control and potential risk of a short-term pullback.


-
 Afghanistan
-
 Albania
-
 Algeria
-
 Angola
-
 Argentina
-
 Armenia
-
 Australia
-
 Austria
-
 Azerbaijan
-
 Bahamas
-
 Bahrain
-
 Bangladesh
-
 Belarus
-
 Belgium
-
 Bolivia
-
 Botswana
-
 Brazil
-
 Brunei
-
 Bulgaria
-
 Cambodia
-
 Cameroon
-
 Canada
-
 Chile
Chile
-
 China
China
-
 Colombia
-
 Congo
Congo
-
 Costa Rica
-
 Cote d'Ivoire
-
 Croatia
-
 Cuba
Cuba
-
 Cyprus
-
 Czechia
-
 DR Congo
-
 Denmark
-
 Dominican Republic
-
 Ecuador
-
 Egypt
Egypt
-
 El Salvador
-
 Estonia
-
 Eswatini
-
 Ethiopia
-
 Finland
-
 France
-
 Georgia
-
 Germany
-
 Ghana
Ghana
-
 Greece
-
 Haiti
Haiti
-
 Hong Kong
-
 Hungary
-
 India
India
-
 Indonesia
-
 Iran, Islamic republic
-
 Iraq
Iraq
-
 Ireland
-
 Israel
-
 Italy
Italy
-
 Jamaica
-
 Japan
Japan
-
 Jordan
-
 Kazakhstan
-
 Kenya
Kenya
-
 Korea
Korea
-
 Kuwait
-
 Kyrgyzstan
-
 Laos
Laos
-
 Latvia
-
 Lebanon
-
 Lesotho
-
 Libya
Libya
-
 Lithuania
-
 Luxembourg
-
 Madagascar
-
 Malaysia
-
 Malta
Malta
-
 Mauritius
-
 Mexico
-
 Moldova
-
 Mongolia
-
 Montenegro
-
 Morocco
-
 Mozambique
-
 Myanmar
-
 Namibia
-
 Nepal
Nepal
-
 Netherlands
-
 New Zealand
-
 Nigeria
-
 North Macedonia
-
 Norway
-
 Oman
Oman
-
 Pakistan
-
 Palestine
-
 Panama
-
 Papua New Guinea
-
 Paraguay
-
 Peru
Peru
-
 Philippines
-
 Poland
-
 Portugal
-
 Puerto Rico
-
 Qatar
Qatar
-
 Reunion
-
 Romania
-
 Rwanda
-
 Saudi Arabia
-
 Serbia
-
 Singapore
-
 Slovakia
-
 Slovenia
-
 Somalia
-
 South Africa
-
 Spain
Spain
-
 Sri Lanka
-
 Sweden
-
 Switzerland
-
 Syria
Syria
-
 Taiwan
-
 Tajikistan
-
 Tanzania
-
 Thailand
-
 Trinidad and Tobago
-
 Tunisia
-
 Turkey
-
 UAE
UAE
-
 Uganda
-
 Ukraine
-
 United Kingdom
-
United States
-
 Uruguay
-
 Uzbekistan
-
 Venezuela
-
 Vietnam
-
 Yemen
Yemen
-
 Zambia
-
 Zimbabwe
- Forex
- Crypto
