
+5.82% for Globalstar stock — Bullish weekly indicators and intraday buying interest emerge

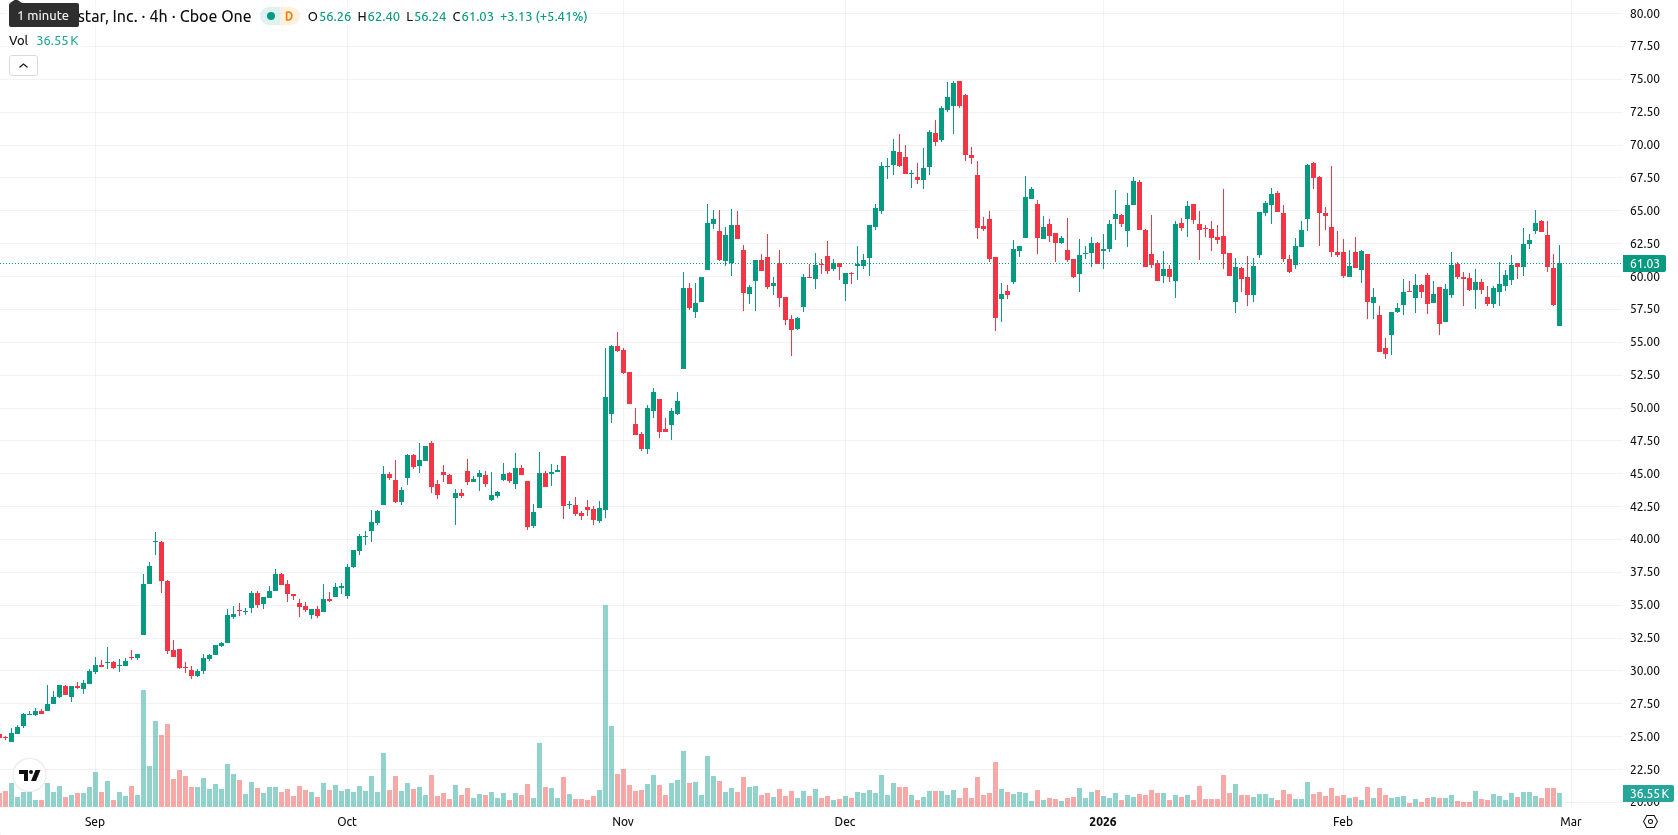
Globalstar, Inc. (GSAT) is trading at $61.25, posting a daily gain of 5.82%. The current price stands above the 20-day moving average ($59.84), just below the 50-day moving average ($61.60), and well above the 200-day moving average ($42.00), signaling robust long-term support but mixed medium-term signals.
Highlights
- Globalstar achieved record full-year revenue of $273 million for 2025, a 9% increase, beating Q4 revenue expectations but missing earnings per share forecasts at -$0.11.
- Strategic developments included the commercial launch of two-way satellite IoT, the RM-200MS module rollout, infrastructure upgrades, and enhanced visibility after Globalstar’s Nasdaq Global Select Market transition.
- GSAT trades at $61.25, with key near-term support at $61.22 and a projected consolidation between $59.00 and $63.50, underpinned by strong buyer momentum and bullish weekly technicals.
Record revenue growth offsets EPS miss as new IoT and partnerships advance
Globalstar reported record full-year revenue of $273 million for the year ended December 31, 2025, an increase of 9% from the prior year. The company topped analyst expectations with fourth-quarter revenue of $71.96 million, though earnings per share missed forecasts at -$0.11. Additional developments include the commercial launch of two-way satellite IoT capabilities, rollout of the RM-200MS module, progress on infrastructure upgrades, and continued strategic partnerships in the government and defense sectors. Globalstar also completed its transition to the Nasdaq Global Select Market, enhancing its market visibility.
Intraday buying surges despite cautious signals from momentum indicators
From a technical standpoint, GSAT is trading just above the Ichimoku Kijun level at $61.22, with this mark serving as immediate support. The short-term outlook is cautious, as the MACD on the daily chart signals a strong sell, the ADX is neutral, and the RSI at 44.17 indicates mild downward pressure, though the Stochastic RSI is in oversold territory and the CCI reads neutral. Bull/Bear Power highlights significant buying interest, which is confirmed by a supportive Awesome Oscillator. Intraday price action displays high volatility, with the session opening lower but rallying to near the highs after significant gains. This divergence between oversold oscillators and strong price momentum underscores considerable intraday buying despite some caution from daily momentum indicators.
Bullish breakout risk rises as consolidation persists within volatility band
Over the next week, GSAT is expected to trade within a typical volatility band of $59.00 to $63.50. There is a more than 80% probability of an upward move based on bullish signals from weekly moving averages, RSI, ADX, and MACD. The baseline scenario calls for a sideways consolidation between $59.00 and $63.50. A decisive move above $63.50 could trigger a bullish breakout if buyer momentum persists, while a drop below $59.00 would shift the outlook bearish and focus attention on the next support level.
Previously it was reported that Globalstar Inc. is sustaining bullish momentum as its price remains above key moving averages, including the 20-, 50-, and 200-day levels, despite elevated short-term selling pressure. Technical indicators are mixed, with the MACD indicating a strong sell, RSI and Stoch RSI reflecting oversold conditions, and dynamic support at $61.22, while near-term resistance persists just above current levels amid high volatility.


Latest Globalstar News


-
 Afghanistan
-
 Albania
-
 Algeria
-
 Angola
-
 Argentina
-
 Armenia
-
 Australia
-
 Austria
-
 Azerbaijan
-
 Bahamas
-
 Bahrain
-
 Bangladesh
-
 Belarus
-
 Belgium
-
 Bolivia
-
 Botswana
-
 Brazil
-
 Brunei
-
 Bulgaria
-
 Cambodia
-
 Cameroon
-
 Canada
-
 Chile
Chile
-
 China
China
-
 Colombia
-
 Congo
Congo
-
 Costa Rica
-
 Cote d'Ivoire
-
 Croatia
-
 Cuba
Cuba
-
 Cyprus
-
 Czechia
-
 DR Congo
-
 Denmark
-
 Dominican Republic
-
 Ecuador
-
 Egypt
Egypt
-
 El Salvador
-
 Estonia
-
 Eswatini
-
 Ethiopia
-
 Finland
-
 France
-
 Georgia
-
 Germany
-
 Ghana
Ghana
-
 Greece
-
 Haiti
Haiti
-
 Hong Kong
-
 Hungary
-
 India
India
-
 Indonesia
-
 Iran, Islamic republic
-
 Iraq
Iraq
-
 Ireland
-
 Israel
-
 Italy
Italy
-
 Jamaica
-
 Japan
Japan
-
 Jordan
-
 Kazakhstan
-
 Kenya
Kenya
-
 Korea
Korea
-
 Kuwait
-
 Kyrgyzstan
-
 Laos
Laos
-
 Latvia
-
 Lebanon
-
 Lesotho
-
 Libya
Libya
-
 Lithuania
-
 Luxembourg
-
 Madagascar
-
 Malaysia
-
 Malta
Malta
-
 Mauritius
-
 Mexico
-
 Moldova
-
 Mongolia
-
 Montenegro
-
 Morocco
-
 Mozambique
-
 Myanmar
-
 Namibia
-
 Nepal
Nepal
-
 Netherlands
-
 New Zealand
-
 Nigeria
-
 North Macedonia
-
 Norway
-
 Oman
Oman
-
 Pakistan
-
 Palestine
-
 Panama
-
 Papua New Guinea
-
 Paraguay
-
 Peru
Peru
-
 Philippines
-
 Poland
-
 Portugal
-
 Puerto Rico
-
 Qatar
Qatar
-
 Reunion
-
 Romania
-
 Rwanda
-
 Saudi Arabia
-
 Serbia
-
 Singapore
-
 Slovakia
-
 Slovenia
-
 Somalia
-
 South Africa
-
 Spain
Spain
-
 Sri Lanka
-
 Sweden
-
 Switzerland
-
 Syria
Syria
-
 Taiwan
-
 Tajikistan
-
 Tanzania
-
 Thailand
-
 Trinidad and Tobago
-
 Tunisia
-
 Turkey
-
 UAE
UAE
-
 Uganda
-
 Ukraine
-
 United Kingdom
-
United States
-
 Uruguay
-
 Uzbekistan
-
 Venezuela
-
 Vietnam
-
 Yemen
Yemen
-
 Zambia
-
 Zimbabwe
- Forex
- Crypto
