
Record annual revenue and mixed technicals — Globalstar stock slips 3.02%

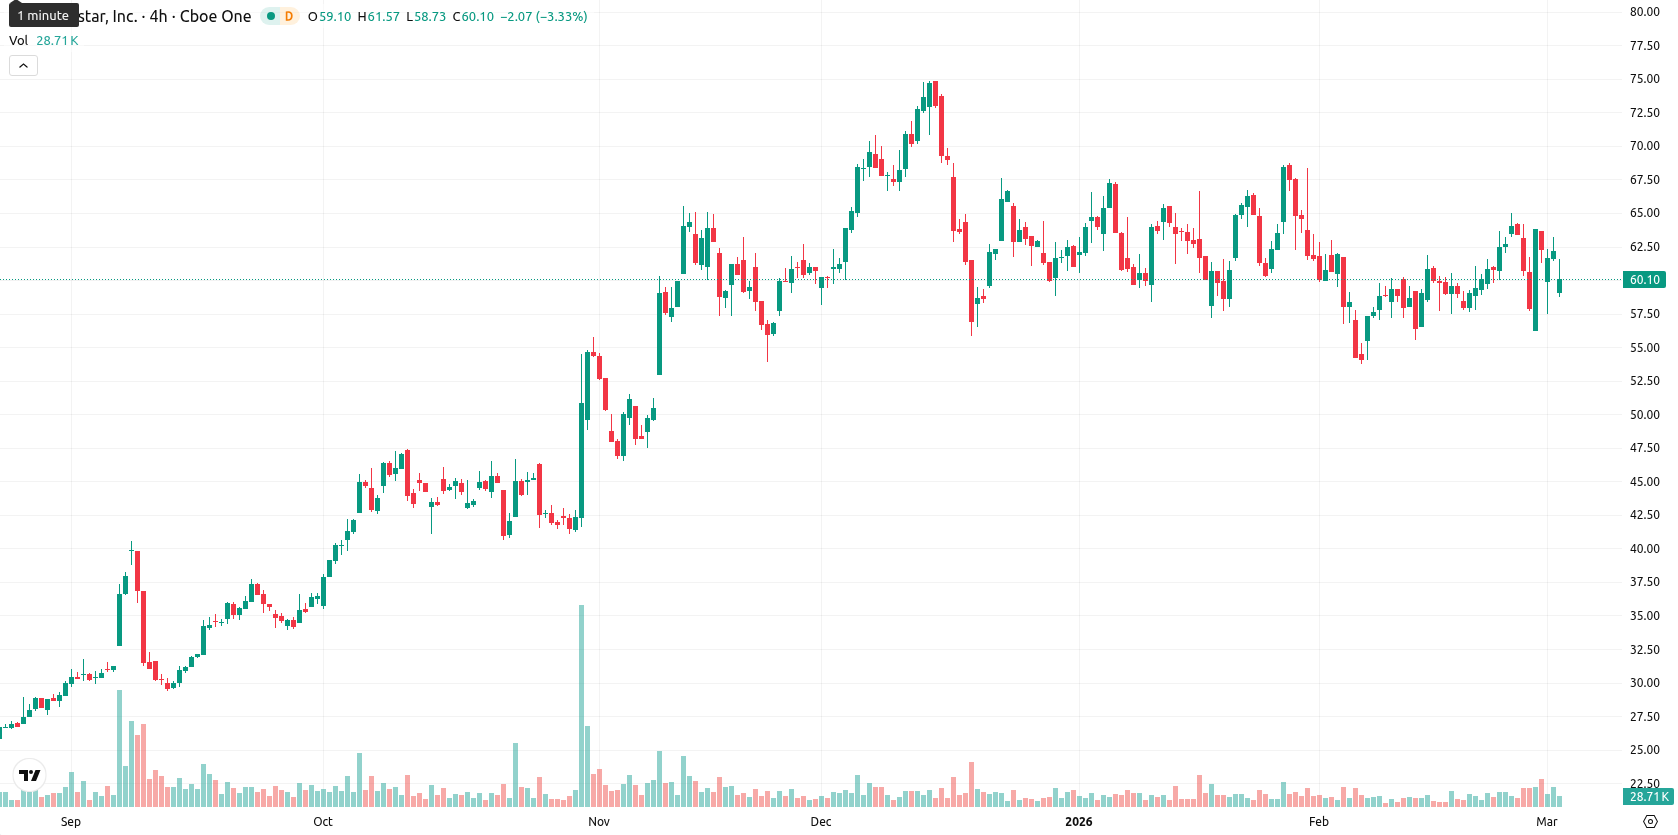
Globalstar, Inc. (GSAT) is trading at $60.13, slightly above the MA-20 ($59.74) but just below the MA-50 ($61.43), indicating a neutral to mildly bullish short-term structure while medium-term action is capped by nearby resistance. The price remains substantially above the MA-200 ($42.44), reinforcing long-term bullish support, and the Ichimoku Kijun at $61.22 stands as immediate resistance.
Highlights
- Globalstar reported record Q4 and full-year 2025 revenue of approximately $72 million, achieving $7.4 million operating income versus a prior-year loss.
- The company is investing in next-generation satellite and terrestrial connectivity, expanding satellite IoT capabilities, and targeting government-sector activity ahead of XCOM RAN's 2026 debut.
- GSAT trades at $60.13 with immediate resistance at $61.22 and key support at $59.74, as technicals suggest likely short-term sideways consolidation within a $54.00–$66.00 range.
Record revenue and growth plans weighed by persistent selling pressure
Globalstar reported record fourth-quarter and full-year 2025 annual revenue of approximately $72 million, with $67.4 million from service revenue and $4.6 million from equipment sales. An income from operations of $7.4 million was achieved, reversing an operating loss from the previous year. The company highlighted ongoing investment in next-generation satellite and terrestrial connectivity, progress in satellite IoT capabilities, and government-sector activity, alongside plans to showcase its XCOM RAN operation at Mobile World Congress Barcelona in March 2026, though price action has remained under broader selling pressure.
Diverging overbought signals and weakening momentum highlight exhaustion risk
Momentum signals on the daily chart are mixed: MACD and ADX suggest a lack of clear trend, while RSI (52.51) and CCI (57.77) point toward mild buyer interest. Stochastic RSI is neutral, but Bull/Bear Power is in overbought territory (2.48), hinting at current buyer dominance. The session opened lower without a gap and has slipped 3.02%, positioning the price in the lower half of today's range ($58.60 – $61.51) with moderate intraday volatility and evident pressure after the open. This muted momentum and overbought signals diverge, suggesting short-term exhaustion despite recent bullish strength.
High upside probability with sideways bias amid firm bullish trends
For the next five trading days, the expected price range is adjusted to $54.00 – $66.00, keeping movements within a 10% volatility band relative to current levels. There is a very high probability (more than 80%) that the price will increase, while a decrease is less likely, given all weekly trend and momentum indicators remain firmly bullish. The baseline scenario foresees sideways consolidation within the range. A bullish resolution would require a breakout above immediate resistance ($61.22), while a bearish turn would be confirmed if the price closes below the key support at $59.74.
Previously it was reported that Globalstar, Inc. is trading above its 20- and 200-day moving averages but just below its 50-day, positioning the stock in a medium- to long-term bullish structure with nearby support and resistance levels. Momentum indicators including MACD and ADX remain neutral while RSI and Stoch RSI signal mild upward bias, highlighting short-term indecision as the stock shows moderate volatility amid fading early-session pressure.


Latest Globalstar News


-
 Afghanistan
-
 Albania
-
 Algeria
-
 Angola
-
 Argentina
-
 Armenia
-
 Australia
-
 Austria
-
 Azerbaijan
-
 Bahamas
-
 Bahrain
-
 Bangladesh
-
 Belarus
-
 Belgium
-
 Bolivia
-
 Botswana
-
 Brazil
-
 Brunei
-
 Bulgaria
-
 Cambodia
-
 Cameroon
-
 Canada
-
 Chile
Chile
-
 China
China
-
 Colombia
-
 Congo
Congo
-
 Costa Rica
-
 Cote d'Ivoire
-
 Croatia
-
 Cuba
Cuba
-
 Cyprus
-
 Czechia
-
 DR Congo
-
 Denmark
-
 Dominican Republic
-
 Ecuador
-
 Egypt
Egypt
-
 El Salvador
-
 Estonia
-
 Eswatini
-
 Ethiopia
-
 Finland
-
 France
-
 Georgia
-
 Germany
-
 Ghana
Ghana
-
 Greece
-
 Haiti
Haiti
-
 Hong Kong
-
 Hungary
-
 India
India
-
 Indonesia
-
 Iran, Islamic republic
-
 Iraq
Iraq
-
 Ireland
-
 Israel
-
 Italy
Italy
-
 Jamaica
-
 Japan
Japan
-
 Jordan
-
 Kazakhstan
-
 Kenya
Kenya
-
 Korea
Korea
-
 Kuwait
-
 Kyrgyzstan
-
 Laos
Laos
-
 Latvia
-
 Lebanon
-
 Lesotho
-
 Libya
Libya
-
 Lithuania
-
 Luxembourg
-
 Madagascar
-
 Malaysia
-
 Malta
Malta
-
 Mauritius
-
 Mexico
-
 Moldova
-
 Mongolia
-
 Montenegro
-
 Morocco
-
 Mozambique
-
 Myanmar
-
 Namibia
-
 Nepal
Nepal
-
 Netherlands
-
 New Zealand
-
 Nigeria
-
 North Macedonia
-
 Norway
-
 Oman
Oman
-
 Pakistan
-
 Palestine
-
 Panama
-
 Papua New Guinea
-
 Paraguay
-
 Peru
Peru
-
 Philippines
-
 Poland
-
 Portugal
-
 Puerto Rico
-
 Qatar
Qatar
-
 Reunion
-
 Romania
-
 Rwanda
-
 Saudi Arabia
-
 Serbia
-
 Singapore
-
 Slovakia
-
 Slovenia
-
 Somalia
-
 South Africa
-
 Spain
Spain
-
 Sri Lanka
-
 Sweden
-
 Switzerland
-
 Syria
Syria
-
 Taiwan
-
 Tajikistan
-
 Tanzania
-
 Thailand
-
 Trinidad and Tobago
-
 Tunisia
-
 Turkey
-
 UAE
UAE
-
 Uganda
-
 Ukraine
-
 United Kingdom
-
United States
-
 Uruguay
-
 Uzbekistan
-
 Venezuela
-
 Vietnam
-
 Yemen
Yemen
-
 Zambia
-
 Zimbabwe
- Forex
- Crypto
