
Broadcom stock: Mixed momentum signals and standout earnings spark a sharp 4.16% rise

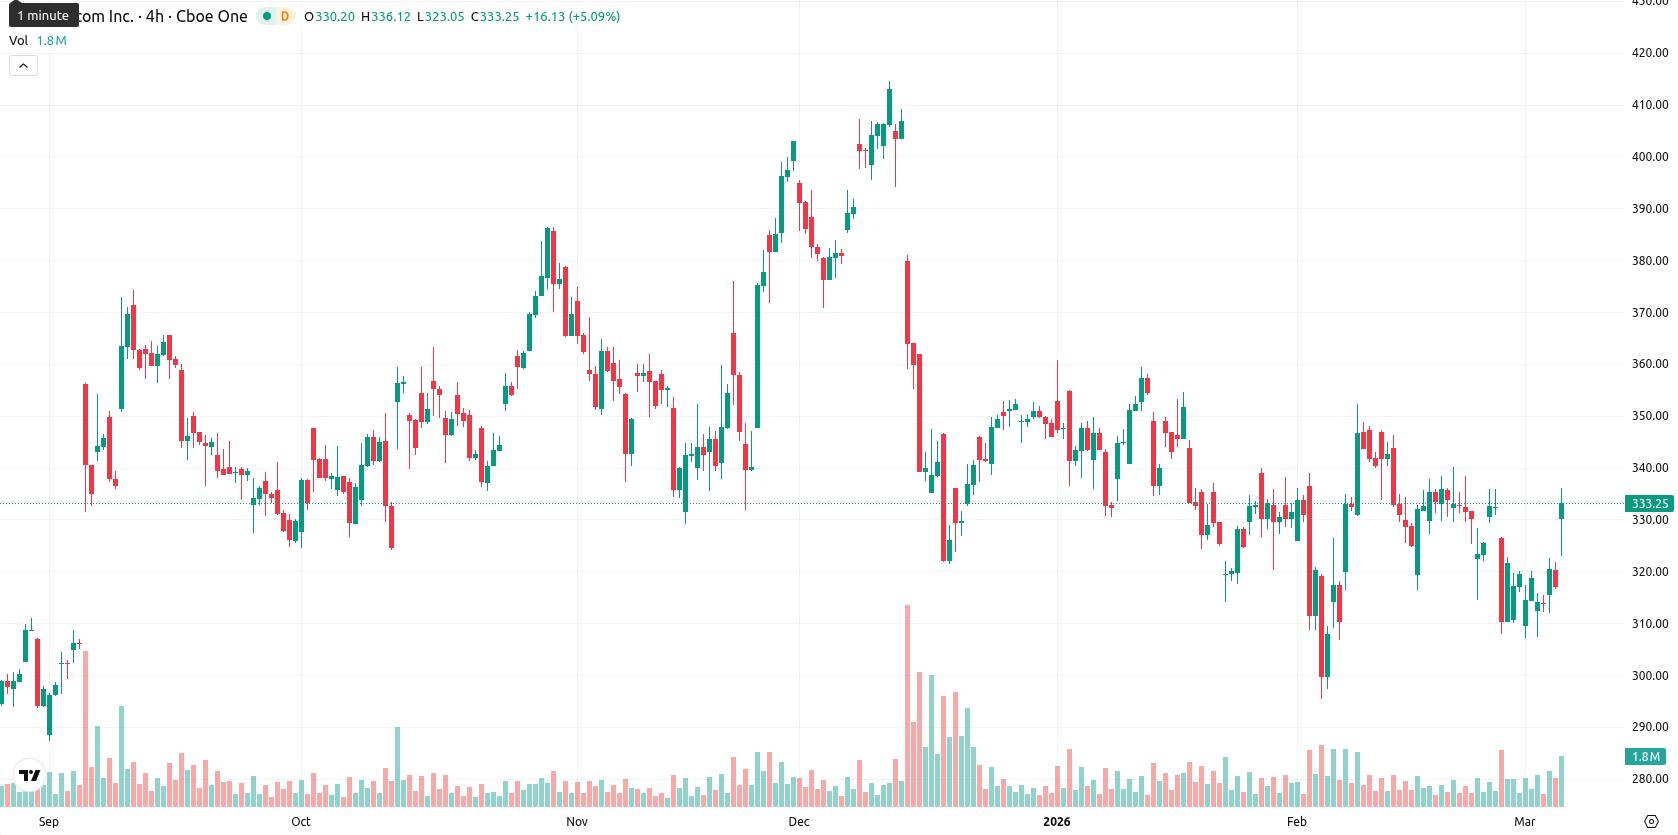
Broadcom Inc. (AVGO) is trading at $330.43, placing it above the MA-20 ($327.34) but just below the MA-50 ($334.68) while staying well above the MA-200 ($319.67). This configuration signals ongoing short-term bullish momentum above the 20-day average, but medium-term pressure from sellers remains, with longer-term trends still supported; the Ichimoku Kijun at $323.82 acts as immediate resistance.
Highlights
- Broadcom delivered record Q1 revenue of $19.3 billion, up 29% year-over-year, powered by strong AI semiconductor sales reaching $8.4 billion.
- Company generated $8.01 billion in free cash flow, approved a new $10 billion buyback, and guided for $22 billion Q2 revenue amid continued AI demand.
- AVGO trades in a volatile $315-$340 range, with mixed technical signals and high probability of near-term consolidation despite bullish session momentum.
Record revenues and buyback as AI sales fuel optimism
Broadcom reported record first quarter fiscal 2026 revenue of $19.311 billion, a 29% increase year-over-year, driven by strong growth in artificial intelligence semiconductor sales reaching $8.4 billion. The company generated $8.01 billion in free cash flow and retained a 68% adjusted EBITDA margin. Broadcom’s board approved a new $10 billion share repurchase program and declared a $0.65 per share quarterly dividend, while issuing guidance for Q2 revenue of approximately $22.0 billion and forecasting continued robust AI demand.
Oscillator divergence intensifies as intraday action defies weak momentum
Momentum signals are mixed, with Daily MACD showing a negative reading and a Sell bias, suggesting lingering downside forces, but ADX remains neutral, pointing to weak trend strength. The Relative Strength Index is in modestly bearish territory, while the Stochastic RSI indicates a Strong Buy and the Commodity Channel Index is bearish — creating notable divergence among oscillators. Bull/Bear Power points to a strongly oversold condition and seller dominance, yet today’s action was bullish, with a sizable gap up at the open, a current price near the session high, high intraday volatility, and pronounced strength toward the top end of the range; momentum indicators conflict with short-term price action.
Consolidation favored as weak indicator alignment caps upside prospects
For the next five trading days, AVGO is expected to trade within a $315.00 to $340.00 volatility band relative to current levels. Given that only one of the four key indicators on the weekly chart is in buy territory, the probability of a sustained upward move is low (less than 20%), making a decline more likely. The baseline scenario sees AVGO consolidating sideways within this range. In a bullish scenario, closing above $334.00–$335.00 could trigger renewed buying toward $340.00, while a drop below $323.80 would open the path to test support at $315.00.
Previously it was reported that Broadcom shares are trading well below their key short- and medium-term moving averages and just under long-term support, with daily momentum indicators such as MACD and RSI confirming persistent bearish pressure, and oversold signals pointing to heightened volatility. Immediate resistance is marked by the Ichimoku Kijun on the daily chart, while the probability of a rebound remains low as sellers maintain control within a tight consolidation range.


Latest Broadcom News


-
 Afghanistan
-
 Albania
-
 Algeria
-
 Angola
-
 Argentina
-
 Armenia
-
 Australia
-
 Austria
-
 Azerbaijan
-
 Bahamas
-
 Bahrain
-
 Bangladesh
-
 Belarus
-
 Belgium
-
 Bolivia
-
 Botswana
-
 Brazil
-
 Brunei
-
 Bulgaria
-
 Cambodia
-
 Cameroon
-
 Canada
-
 Chile
Chile
-
 China
China
-
 Colombia
-
 Congo
Congo
-
 Costa Rica
-
 Cote d'Ivoire
-
 Croatia
-
 Cuba
Cuba
-
 Cyprus
-
 Czechia
-
 DR Congo
-
 Denmark
-
 Dominican Republic
-
 Ecuador
-
 Egypt
Egypt
-
 El Salvador
-
 Estonia
-
 Eswatini
-
 Ethiopia
-
 Finland
-
 France
-
 Georgia
-
 Germany
-
 Ghana
Ghana
-
 Greece
-
 Haiti
Haiti
-
 Hong Kong
-
 Hungary
-
 India
India
-
 Indonesia
-
 Iran, Islamic republic
-
 Iraq
Iraq
-
 Ireland
-
 Israel
-
 Italy
Italy
-
 Jamaica
-
 Japan
Japan
-
 Jordan
-
 Kazakhstan
-
 Kenya
Kenya
-
 Korea
Korea
-
 Kuwait
-
 Kyrgyzstan
-
 Laos
Laos
-
 Latvia
-
 Lebanon
-
 Lesotho
-
 Libya
Libya
-
 Lithuania
-
 Luxembourg
-
 Madagascar
-
 Malaysia
-
 Malta
Malta
-
 Mauritius
-
 Mexico
-
 Moldova
-
 Mongolia
-
 Montenegro
-
 Morocco
-
 Mozambique
-
 Myanmar
-
 Namibia
-
 Nepal
Nepal
-
 Netherlands
-
 New Zealand
-
 Nigeria
-
 North Macedonia
-
 Norway
-
 Oman
Oman
-
 Pakistan
-
 Palestine
-
 Panama
-
 Papua New Guinea
-
 Paraguay
-
 Peru
Peru
-
 Philippines
-
 Poland
-
 Portugal
-
 Puerto Rico
-
 Qatar
Qatar
-
 Reunion
-
 Romania
-
 Rwanda
-
 Saudi Arabia
-
 Serbia
-
 Singapore
-
 Slovakia
-
 Slovenia
-
 Somalia
-
 South Africa
-
 Spain
Spain
-
 Sri Lanka
-
 Sweden
-
 Switzerland
-
 Syria
Syria
-
 Taiwan
-
 Tajikistan
-
 Tanzania
-
 Thailand
-
 Trinidad and Tobago
-
 Tunisia
-
 Turkey
-
 UAE
UAE
-
 Uganda
-
 Ukraine
-
 United Kingdom
-
United States
-
 Uruguay
-
 Uzbekistan
-
 Venezuela
-
 Vietnam
-
 Yemen
Yemen
-
 Zambia
-
 Zimbabwe
- Forex
- Crypto
