
AST SpaceMobile stock: Mixed technicals and strong revenue news drive a 5.98% jump

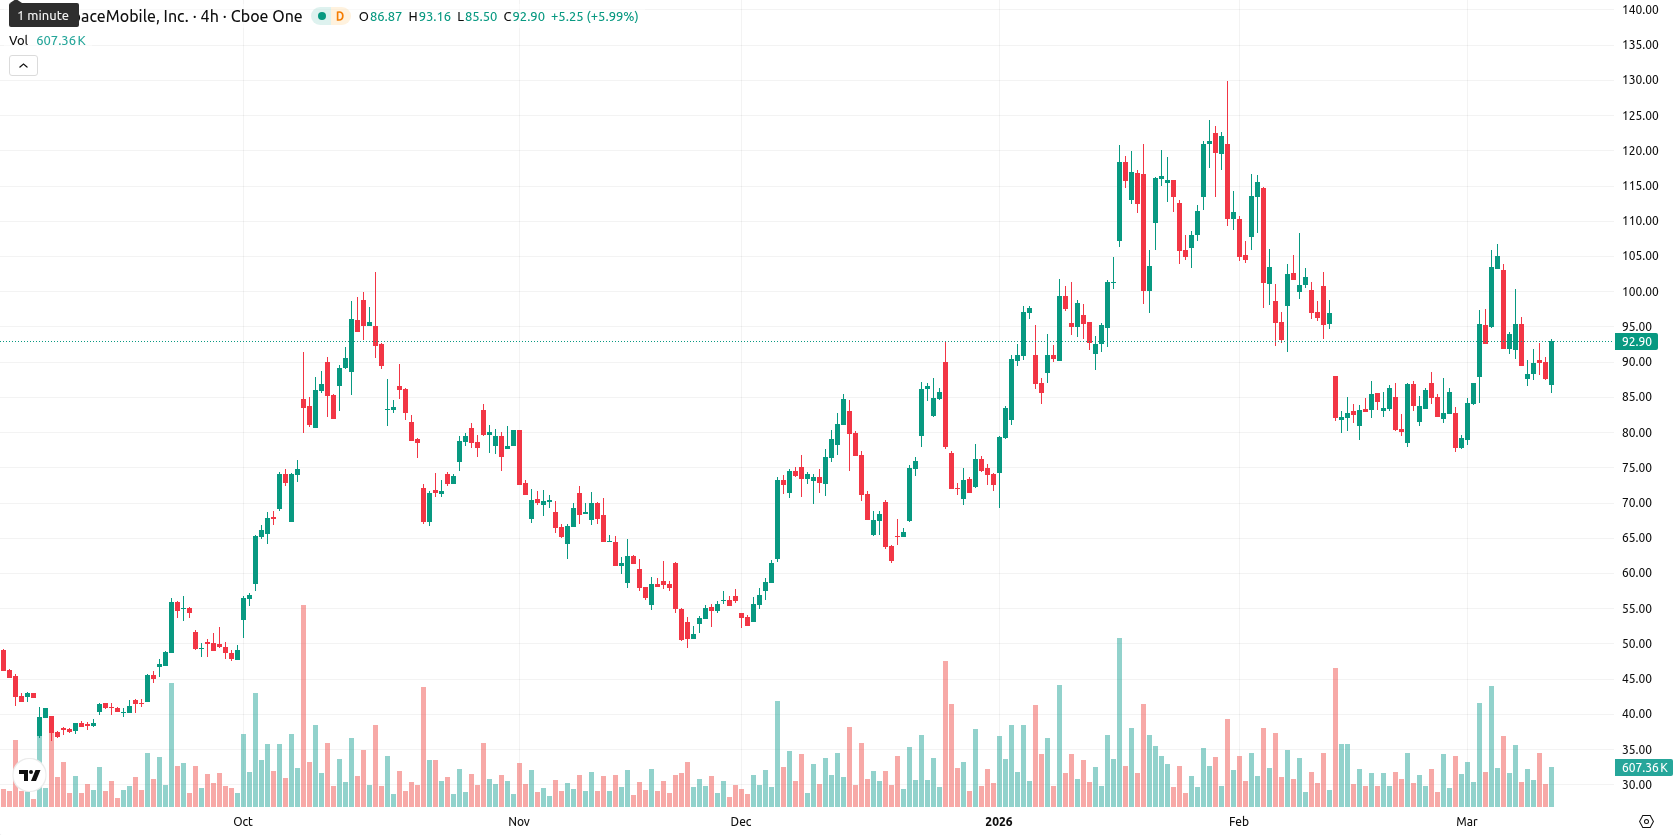
AST SpaceMobile (ASTS) is trading at $92.76 after a daily gain of 5.98%. The price stands above the SMA-20 ($87.71) but just below the SMA-50 ($94.63), with both short-term averages well above the long-term SMA-200 ($65.16), highlighting mixed signals in the near and medium term but implying underlying support over the longer term. Immediate resistance is noted at the Ichimoku Kijun level of $96.94.
Highlights
- AST SpaceMobile has transitioned to a revenue-generating operator, posting $70.9 million full-year 2025 revenue led by gateway hardware and government contracts.
- AT&T's strategic partnership with AST SpaceMobile targets expanded U.S. wireless reach, while strong customer demand creates a sizable order backlog.
- Technicals indicate high volatility, with strong buying and an 80%+ probability of a bullish move toward the $83.50–$101.00 range if resistance at $96.94 breaks.
Revenue outlook improves as AT&T partnership bolsters demand and backlog
AST SpaceMobile has reported it is now a revenue-generating company following its Q4 earnings call, achieving full-year revenue of $70.9 million in 2025, driven mainly by $54.3 million from gateway hardware, government milestones, and consulting for mobile network operators. The company has transitioned from technology demonstrator to early-stage operator, citing a sizable backlog and ongoing demand from both mobile network operators and government clients. AT&T has additionally confirmed a partnership with AST SpaceMobile to enhance U.S. wireless coverage as part of broader rural infrastructure investments, while the company disclosed that average capital costs per Block 2 satellite, including materials and launch, are estimated at $21 million to $23 million.
Conflicting momentum as MACD sell contrasts with intraday buyer strength
Technical signals for ASTS are mixed. The price remains above the SMA-20 but just under the SMA-50, with additional medium-term resistance at the Ichimoku Kijun ($96.94). Momentum indicators diverge: daily MACD issues a strong sell, while ADX is neutral, suggesting weak trend conviction. RSI is at 47.40, CCI is neutral, and Stoch RSI is flat, indicating neither overbought nor oversold pressures. BBP signals overbought conditions and points toward buyer dominance, consistent with strong intraday gains and high volatility, but overall oscillators present conflicting short-term momentum cues.
Bullish breakout risk rises as weekly volatility bands widen
Over the coming week, ASTS is likely to trade within a volatility band of $83.50 – $101.00 relative to current levels. Weekly moving averages and key momentum signals suggest a high probability (above 80%) of further upward movement, though the baseline scenario calls for consolidation within a sideways corridor. A close above $96.94 would signal a bullish breakout, while losing support near $87.00 could trigger a bearish move.
Currently, AST SpaceMobile Inc. is trading above its short-term moving average while remaining slightly below medium-term technical resistance, with longer-term indicators showing firm underlying support. Momentum signals are mixed, as strong intraday bullishness contrasts with cautious trend indicators, suggesting elevated volatility amid uncertainty over sustained directional conviction.


Latest AST SpaceMobile News


-
 Afghanistan
-
 Albania
-
 Algeria
-
 Angola
-
 Argentina
-
 Armenia
-
 Australia
-
 Austria
-
 Azerbaijan
-
 Bahamas
-
 Bahrain
-
 Bangladesh
-
 Belarus
-
 Belgium
-
 Bolivia
-
 Botswana
-
 Brazil
-
 Brunei
-
 Bulgaria
-
 Cambodia
-
 Cameroon
-
 Canada
-
 Chile
Chile
-
 China
China
-
 Colombia
-
 Congo
Congo
-
 Costa Rica
-
 Cote d'Ivoire
-
 Croatia
-
 Cuba
Cuba
-
 Cyprus
-
 Czechia
-
 DR Congo
-
 Denmark
-
 Dominican Republic
-
 Ecuador
-
 Egypt
Egypt
-
 El Salvador
-
 Estonia
-
 Eswatini
-
 Ethiopia
-
 Finland
-
 France
-
 Georgia
-
 Germany
-
 Ghana
Ghana
-
 Greece
-
 Haiti
Haiti
-
 Hong Kong
-
 Hungary
-
 India
India
-
 Indonesia
-
 Iran, Islamic republic
-
 Iraq
Iraq
-
 Ireland
-
 Israel
-
 Italy
Italy
-
 Jamaica
-
 Japan
Japan
-
 Jordan
-
 Kazakhstan
-
 Kenya
Kenya
-
 Korea
Korea
-
 Kuwait
-
 Kyrgyzstan
-
 Laos
Laos
-
 Latvia
-
 Lebanon
-
 Lesotho
-
 Libya
Libya
-
 Lithuania
-
 Luxembourg
-
 Madagascar
-
 Malaysia
-
 Malta
Malta
-
 Mauritius
-
 Mexico
-
 Moldova
-
 Mongolia
-
 Montenegro
-
 Morocco
-
 Mozambique
-
 Myanmar
-
 Namibia
-
 Nepal
Nepal
-
 Netherlands
-
 New Zealand
-
 Nigeria
-
 North Macedonia
-
 Norway
-
 Oman
Oman
-
 Pakistan
-
 Palestine
-
 Panama
-
 Papua New Guinea
-
 Paraguay
-
 Peru
Peru
-
 Philippines
-
 Poland
-
 Portugal
-
 Puerto Rico
-
 Qatar
Qatar
-
 Reunion
-
 Romania
-
 Rwanda
-
 Saudi Arabia
-
 Serbia
-
 Singapore
-
 Slovakia
-
 Slovenia
-
 Somalia
-
 South Africa
-
 Spain
Spain
-
 Sri Lanka
-
 Sweden
-
 Switzerland
-
 Syria
Syria
-
 Taiwan
-
 Tajikistan
-
 Tanzania
-
 Thailand
-
 Trinidad and Tobago
-
 Tunisia
-
 Turkey
-
 UAE
UAE
-
 Uganda
-
 Ukraine
-
 United Kingdom
-
United States
-
 Uruguay
-
 Uzbekistan
-
 Venezuela
-
 Vietnam
-
 Yemen
Yemen
-
 Zambia
-
 Zimbabwe
- Forex
- Crypto
