
AST SpaceMobile stock price forecast: $71.80–$89.52 range in focus as ASTS drops 5.58%

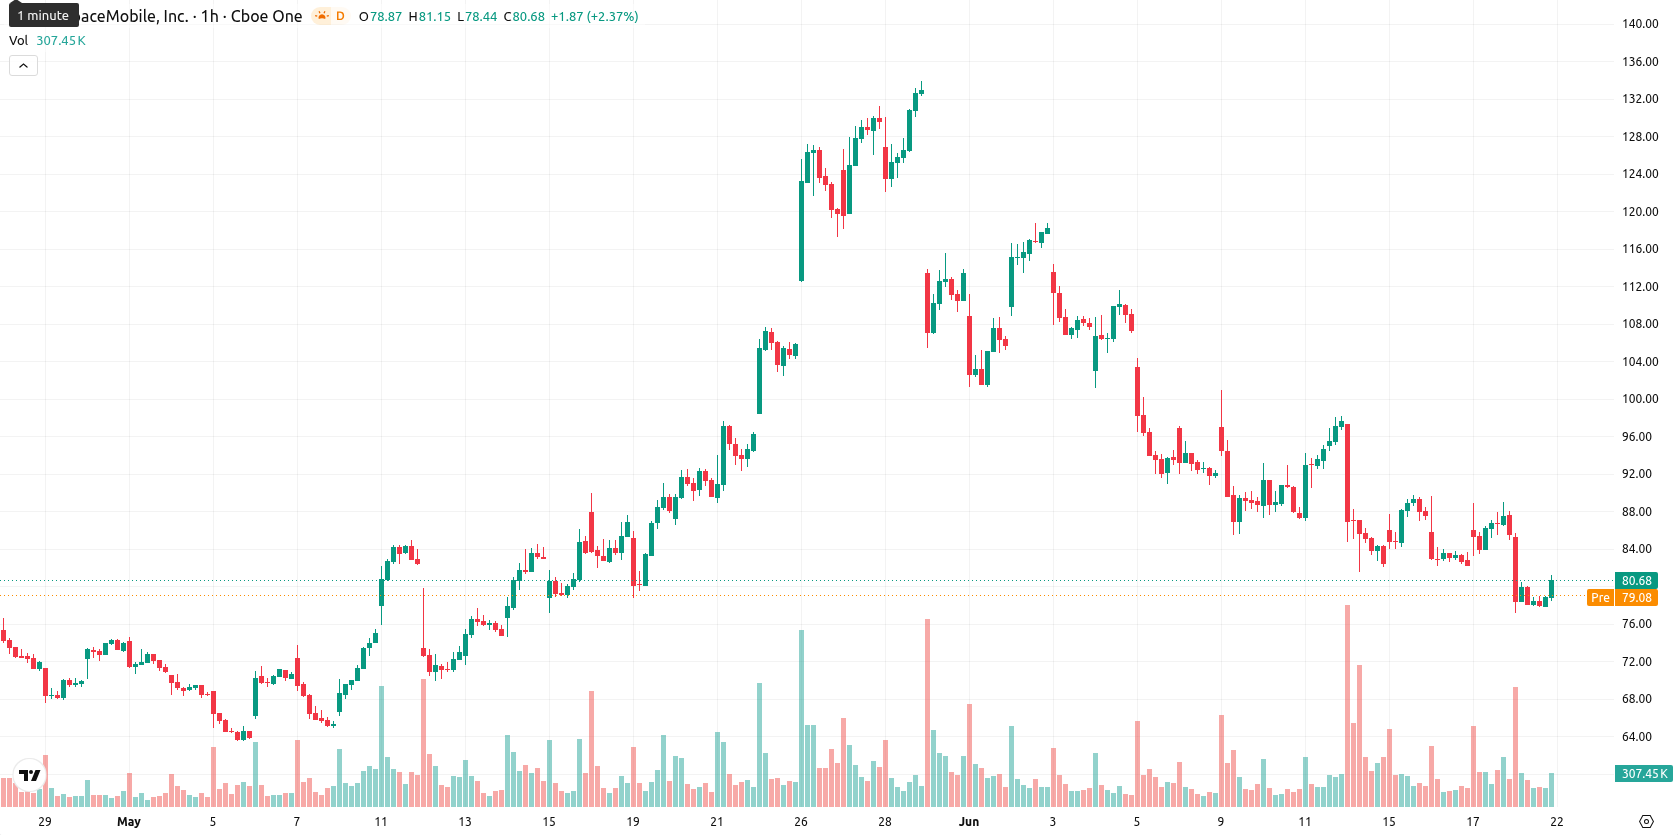
AST SpaceMobile (ASTS) stock is trading at $80.66, down 5.58% on the day and sitting below its key short- and medium-term moving averages, while remaining just above the longer-term average.
Highlights
- AST SpaceMobile's Q1 2026 revenue surged to $14.7 million from $718,000 year-over-year, reflecting rapid commercial scaling.
- Launch of BlueBird 8–10 satellites aboard SpaceX Falcon 9 expanded AST's low Earth orbit network and doubled peak data speeds, marking a shift from testing to wider service rollout.
- Technicals remain bearish with price under short- and medium-term averages, high volatility, and a forecasted trading range of $71.8 to $89.52 over the next 2–3 days.
Operations advance as revenue surges and new satellites bolster network
AST SpaceMobile reported first-quarter 2026 revenue of $14.7 million, rising sharply from $718,000 during the same period a year earlier, according to Foreignpolicyjournal. The company also successfully launched and deployed its BlueBird 8, 9, and 10 satellites aboard a SpaceX Falcon 9 from Cape Canaveral, expanding its low Earth orbit network and improving system capacity. These new Block 2 satellites contain advanced communications arrays and almost double the peak data speeds of previous generations, representing an operational move from testing toward large-scale service delivery. The fundamental backdrop showed material progress in the company’s business, though price action has remained under broader selling pressure.
Selling pressure persists as momentum weakens near final support
ASTS is trading below the MA-20 and MA-50 on the hourly chart, indicating ongoing short- and medium-term selling pressure, while it remains just above the MA-200 on the daily timeframe, which acts as the last major support. The immediate resistance is established by the Ichimoku Kijun level at $83.44. Momentum signals remain weak: the MACD gives a Sell signal, ADX is Neutral, and the CCI also points to Sell. RSI stands at 43.04, a bearish reading, and BBP is Oversold, further confirming ongoing seller dominance, though Stoch RSI and the Awesome Oscillator both read as Neutral and suggest a lack of conviction for a strong reversal. Volatility is high, resulting in choppy price action intraday.
Downside favored as high volatility limits reversal odds
Over the next 2–3 trading days, ASTS is forecast to trade within a broad band between $71.8 and $89.52, based on recent volatility. There is a high probability (75%) that downside moves persist, and only a 25% chance of reversal higher. The baseline expectation is for price to remain rangebound within this corridor; a move above resistance at $83.44 would be required to trigger a bullish breakout, while loss of near-term support could accelerate declines toward the lower edge of the forecast range.
Earlier, analysts noted that despite notable operational achievements, AST SpaceMobile’s stock remained weighed down by persistent technical pressure and an uncertain recovery outlook. The current update reinforces this directional bias, as new revenue milestones and satellite deployments have yet to offset dominant selling pressure, and traders should monitor for a decisive break of the MA-200 as a key signal for potential downside acceleration.


Latest AST SpaceMobile News


-
 Afghanistan
-
 Albania
-
 Algeria
-
 Angola
-
 Argentina
-
 Armenia
-
 Australia
-
 Austria
-
 Azerbaijan
-
 Bahamas
-
 Bahrain
-
 Bangladesh
-
 Belarus
-
 Belgium
-
 Bolivia
-
 Botswana
-
 Brazil
-
 Brunei
-
 Bulgaria
-
 Cambodia
-
 Cameroon
-
 Canada
-
 Chile
Chile
-
 China
China
-
 Colombia
-
 Congo
Congo
-
 Costa Rica
-
 Cote d'Ivoire
-
 Croatia
-
 Cuba
Cuba
-
 Cyprus
-
 Czechia
-
 DR Congo
-
 Denmark
-
 Dominican Republic
-
 Ecuador
-
 Egypt
Egypt
-
 El Salvador
-
 Estonia
-
 Eswatini
-
 Ethiopia
-
 Finland
-
 France
-
 Georgia
-
 Germany
-
 Ghana
Ghana
-
 Greece
-
 Haiti
Haiti
-
 Hong Kong
-
 Hungary
-
 India
India
-
 Indonesia
-
 Iran, Islamic republic
-
 Iraq
Iraq
-
 Ireland
-
 Israel
-
 Italy
Italy
-
 Jamaica
-
 Japan
Japan
-
 Jordan
-
 Kazakhstan
-
 Kenya
Kenya
-
 Korea
Korea
-
 Kuwait
-
 Kyrgyzstan
-
 Laos
Laos
-
 Latvia
-
 Lebanon
-
 Lesotho
-
 Libya
Libya
-
 Lithuania
-
 Luxembourg
-
 Madagascar
-
 Malaysia
-
 Malta
Malta
-
 Mauritius
-
 Mexico
-
 Moldova
-
 Mongolia
-
 Montenegro
-
 Morocco
-
 Mozambique
-
 Myanmar
-
 Namibia
-
 Nepal
Nepal
-
 Netherlands
-
 New Zealand
-
 Nigeria
-
 North Macedonia
-
 Norway
-
 Oman
Oman
-
 Pakistan
-
 Palestine
-
 Panama
-
 Papua New Guinea
-
 Paraguay
-
 Peru
Peru
-
 Philippines
-
 Poland
-
 Portugal
-
 Puerto Rico
-
 Qatar
Qatar
-
 Reunion
-
 Romania
-
 Rwanda
-
 Saudi Arabia
-
 Serbia
-
 Singapore
-
 Slovakia
-
 Slovenia
-
 Somalia
-
 South Africa
-
 Spain
Spain
-
 Sri Lanka
-
 Sweden
-
 Switzerland
-
 Syria
Syria
-
 Taiwan
-
 Tajikistan
-
 Tanzania
-
 Thailand
-
 Trinidad and Tobago
-
 Tunisia
-
 Turkey
-
 UAE
UAE
-
 Uganda
-
 Ukraine
-
 United Kingdom
-
United States
-
 Uruguay
-
 Uzbekistan
-
 Venezuela
-
 Vietnam
-
 Yemen
Yemen
-
 Zambia
-
 Zimbabwe
- Forex
- Crypto
