
Oversold signals and resistance at $2.29 — NuCana stock gains 3.08%

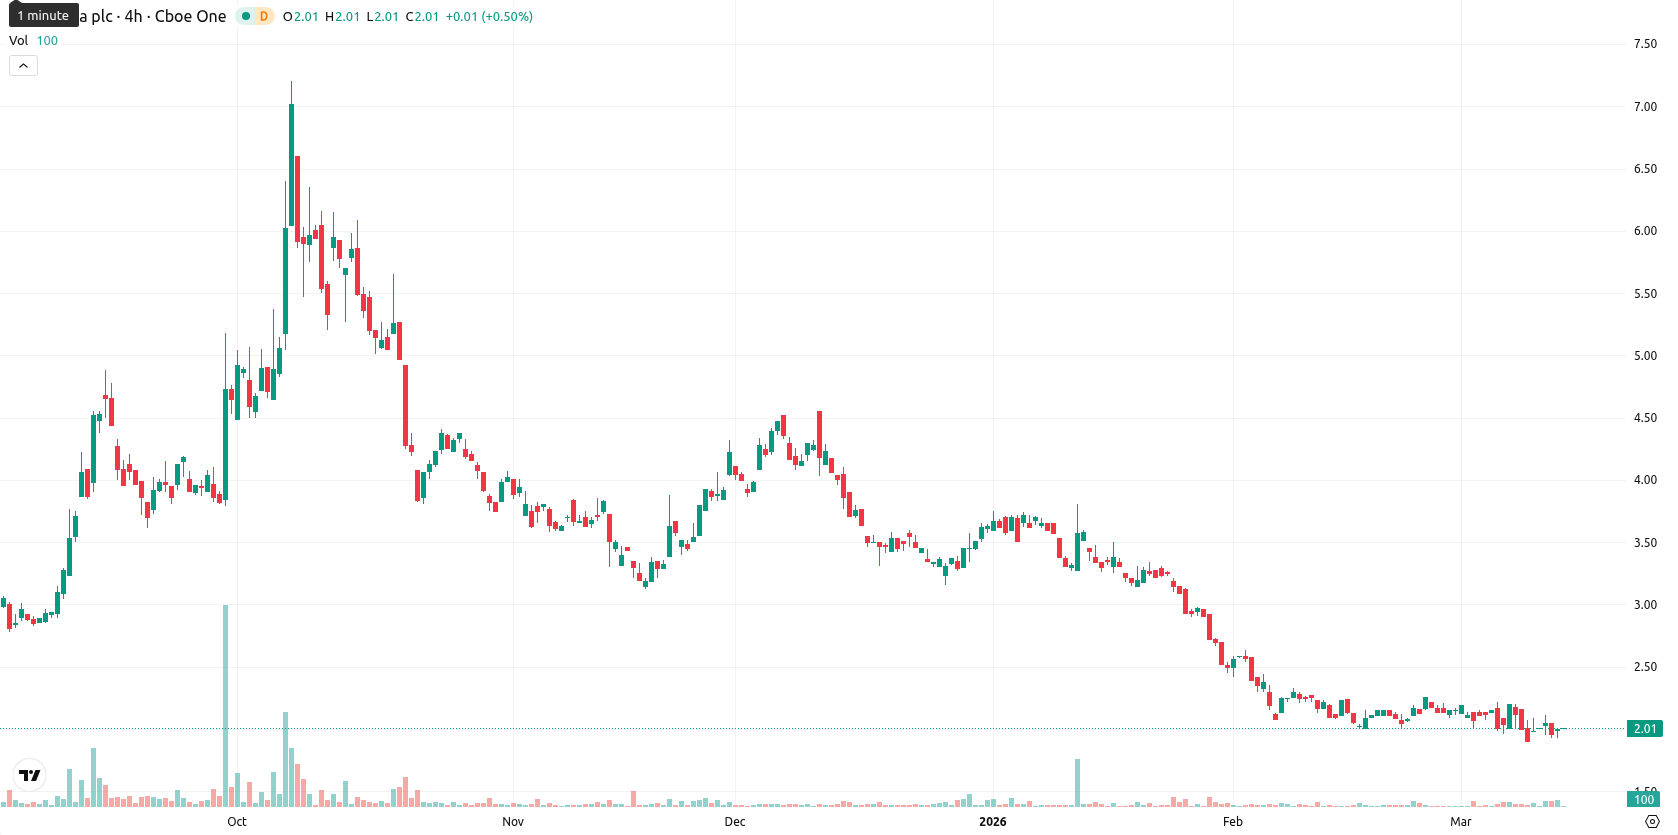
NuCana plc ADR (NCNA) is trading at $2.01, posting a daily gain of 3.08%. This level sits below the SMA-20 ($2.10), SMA-50 ($2.69), and SMA-200 ($6.03), reflecting persistent seller pressure across all timeframes.
Highlights
- NCNA trades under major moving averages, indicating persistent seller dominance across short, medium, and long-term horizons.
- Momentum indicators suggest a bearish trend with oversold signals emerging, but a modest intraday recovery highlights uncertainty.
- Baseline scenario points to sideways action between $1.80 and $2.15, with a sub-20% chance of a sustained upside breakout.
Oversold signals and weak momentum as resistance caps recovery
Technically, the Ichimoku Kijun on the daily chart stands at $2.29, which marks immediate resistance. Short-term momentum is weak with the MACD generating a Strong Sell and the ADX showing a Sell stance, while the RSI at 36.37 and CCI at –160.61 both indicate the stock is nearing oversold territory. The BBP remains slightly positive at 0.04, suggesting that buyers are effecting a modest recovery, with Stoch RSI and CCI flagging oversold conditions on both daily and weekly timeframes. A moderate gap up from the prior close ($1.95) to today’s open ($1.99) points to moderate volatility, and the price is currently at the top of today’s $1.93 – $2.01 range.
Further declines likely as rally faces low probability
Looking ahead, the expected weekly price range for NCNA is $1.80 to $2.15, reflecting typical volatility. The probability of a sustained rally is very low (under 20%), making further declines more likely. The base scenario is for sideways trading within this band, but a clear bullish signal would require a move above $2.29, while a bearish scenario would be confirmed by a drop below $1.80 and accelerated downside momentum.
Previously it was reported that NuCana plc ADR (NCNA) is trading below its key short, medium, and long-term moving averages, with technical indicators such as MACD ADX and RSI continuing to signal bearish momentum and potential oversold conditions. The stock faces persistent downside risk as resistance at the Ichimoku Kijun level holds, while intraday signals and low volatility indicate sellers remain in control despite mild rebound attempts.


Latest NuCana News


-
 Afghanistan
-
 Albania
-
 Algeria
-
 Angola
-
 Argentina
-
 Armenia
-
 Australia
-
 Austria
-
 Azerbaijan
-
 Bahamas
-
 Bahrain
-
 Bangladesh
-
 Belarus
-
 Belgium
-
 Bolivia
-
 Botswana
-
 Brazil
-
 Brunei
-
 Bulgaria
-
 Cambodia
-
 Cameroon
-
 Canada
-
 Chile
Chile
-
 China
China
-
 Colombia
-
 Congo
Congo
-
 Costa Rica
-
 Cote d'Ivoire
-
 Croatia
-
 Cuba
Cuba
-
 Cyprus
-
 Czechia
-
 DR Congo
-
 Denmark
-
 Dominican Republic
-
 Ecuador
-
 Egypt
Egypt
-
 El Salvador
-
 Estonia
-
 Eswatini
-
 Ethiopia
-
 Finland
-
 France
-
 Georgia
-
 Germany
-
 Ghana
Ghana
-
 Greece
-
 Haiti
Haiti
-
 Hong Kong
-
 Hungary
-
 India
India
-
 Indonesia
-
 Iran, Islamic republic
-
 Iraq
Iraq
-
 Ireland
-
 Israel
-
 Italy
Italy
-
 Jamaica
-
 Japan
Japan
-
 Jordan
-
 Kazakhstan
-
 Kenya
Kenya
-
 Korea
Korea
-
 Kuwait
-
 Kyrgyzstan
-
 Laos
Laos
-
 Latvia
-
 Lebanon
-
 Lesotho
-
 Libya
Libya
-
 Lithuania
-
 Luxembourg
-
 Madagascar
-
 Malaysia
-
 Malta
Malta
-
 Mauritius
-
 Mexico
-
 Moldova
-
 Mongolia
-
 Montenegro
-
 Morocco
-
 Mozambique
-
 Myanmar
-
 Namibia
-
 Nepal
Nepal
-
 Netherlands
-
 New Zealand
-
 Nigeria
-
 North Macedonia
-
 Norway
-
 Oman
Oman
-
 Pakistan
-
 Palestine
-
 Panama
-
 Papua New Guinea
-
 Paraguay
-
 Peru
Peru
-
 Philippines
-
 Poland
-
 Portugal
-
 Puerto Rico
-
 Qatar
Qatar
-
 Reunion
-
 Romania
-
 Rwanda
-
 Saudi Arabia
-
 Serbia
-
 Singapore
-
 Slovakia
-
 Slovenia
-
 Somalia
-
 South Africa
-
 Spain
Spain
-
 Sri Lanka
-
 Sweden
-
 Switzerland
-
 Syria
Syria
-
 Taiwan
-
 Tajikistan
-
 Tanzania
-
 Thailand
-
 Trinidad and Tobago
-
 Tunisia
-
 Turkey
-
 UAE
UAE
-
 Uganda
-
 Ukraine
-
 United Kingdom
-
United States
-
 Uruguay
-
 Uzbekistan
-
 Venezuela
-
 Vietnam
-
 Yemen
Yemen
-
 Zambia
-
 Zimbabwe
- Forex
- Crypto
