
Robinhood stock: Persistent seller pressure drives renewed declines in volatile session

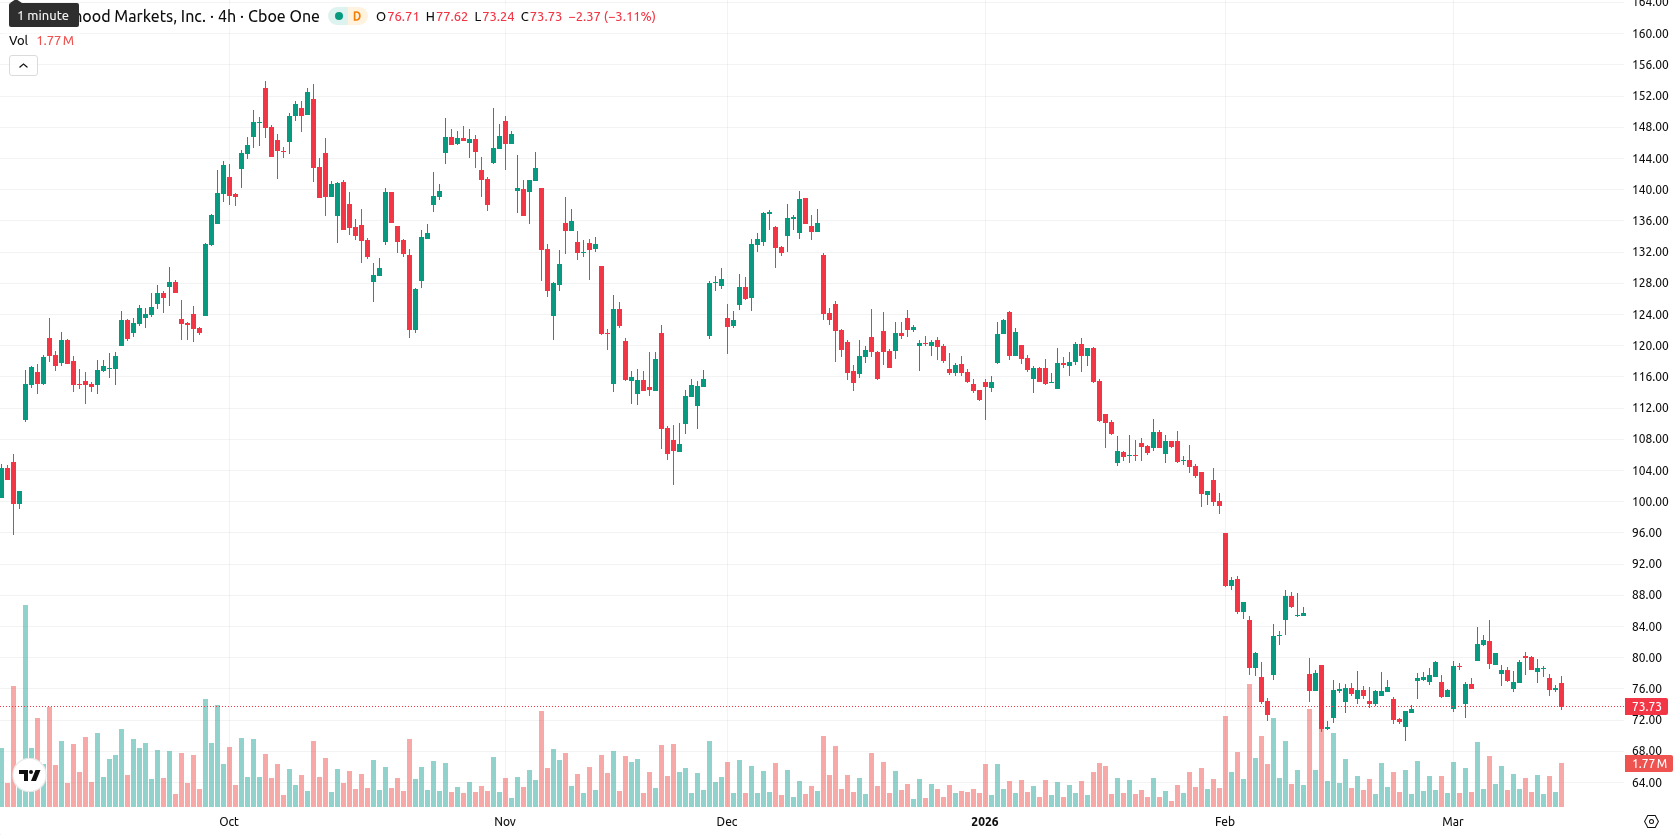
Robinhood Markets Inc (HOOD) is trading at $73.50 after declining 3.44% today, positioning itself below the SMA-20 ($76.74), SMA-50 ($93.05), and SMA-200 ($107.63). The price remains under significant downside pressure across the short-, medium-, and long-term trends, with immediate resistance indicated by the Ichimoku Kijun level at $78.91.
Highlights
- Robinhood's Gold subscriber base surged 58% year over year to 4.2 million, driving record $710 billion equity trading volumes.
- Operating expenses climbed 38.2% to $633 million amid new AI product launches and expanded account offerings, pressuring profitability.
- Shares trade below major moving averages with strong bearish momentum; downside likely, short-term range seen at $71.25–$77.10.
Product launches and subscriber growth amid selling and market volatility
Robinhood introduced Cortex Digests, an AI-driven insights tool for its paid Gold tier, and launched trust and custodial accounts to broaden its product offerings. In its latest quarter, Gold subscribers increased 58% year over year to 4.2 million, and equity notional trading volumes reached a record $710 billion after rising 68% year over year, while total operating expenses rose to $633 million, up 38.2%. The company also reported $25 million in securities lending revenue for February 2026, up 14% from February 2025 but down 26% from January 2026, and on March 13, 2026, Robinhood shares were affected by broader market volatility, though price action has remained under broader selling pressure.
Bearish momentum persists as oscillators confirm oversold pressure
Technical analysis reveals prevailing bearish momentum for HOOD, as it trades below all observed moving averages, with the Ichimoku Kijun level at $78.91 acting as near resistance. Both MACD and ADX confirm a strong negative trend, while the RSI reads 41.61, indicating mild weakness that has not yet reached oversold levels. Stoch RSI and Bull/Bear Power (BBP) register oversold conditions and highlight seller dominance during the session; meanwhile, CCI is neutral and the Awesome Oscillator offers no clear direction. Volatility is elevated following an intraday reversal from a higher open, with the overall tone remaining bearish as momentum signals reinforce the selling environment.
Downside risk persists as consolidation and resistance cap upside
For the coming week, the typical volatility range is expected between $71.25 and $77.10. With less than a 20% likelihood of a move higher, a sideways consolidation near current levels is most probable. Upside recovery would require a sustained break above resistance at $78.91, targeting a move toward $77.10. A more likely scenario envisions renewed declines below $71.25, signaling continued downside risk.
Earlier, analysts noted that Robinhood remained under persistent bearish pressure, with sustained downside momentum across major technical indicators. The current analysis reinforces this negative outlook, highlighting continued vulnerability to renewed declines, making price action below $71.25 a critical downside risk for traders to monitor in the week ahead.


Latest Robinhood News


-
 Afghanistan
-
 Albania
-
 Algeria
-
 Angola
-
 Argentina
-
 Armenia
-
 Australia
-
 Austria
-
 Azerbaijan
-
 Bahamas
-
 Bahrain
-
 Bangladesh
-
 Belarus
-
 Belgium
-
 Bolivia
-
 Botswana
-
 Brazil
-
 Brunei
-
 Bulgaria
-
 Cambodia
-
 Cameroon
-
 Canada
-
 Chile
Chile
-
 China
China
-
 Colombia
-
 Congo
Congo
-
 Costa Rica
-
 Cote d'Ivoire
-
 Croatia
-
 Cuba
Cuba
-
 Cyprus
-
 Czechia
-
 DR Congo
-
 Denmark
-
 Dominican Republic
-
 Ecuador
-
 Egypt
Egypt
-
 El Salvador
-
 Estonia
-
 Eswatini
-
 Ethiopia
-
 Finland
-
 France
-
 Georgia
-
 Germany
-
 Ghana
Ghana
-
 Greece
-
 Haiti
Haiti
-
 Hong Kong
-
 Hungary
-
 India
India
-
 Indonesia
-
 Iran, Islamic republic
-
 Iraq
Iraq
-
 Ireland
-
 Israel
-
 Italy
Italy
-
 Jamaica
-
 Japan
Japan
-
 Jordan
-
 Kazakhstan
-
 Kenya
Kenya
-
 Korea
Korea
-
 Kuwait
-
 Kyrgyzstan
-
 Laos
Laos
-
 Latvia
-
 Lebanon
-
 Lesotho
-
 Libya
Libya
-
 Lithuania
-
 Luxembourg
-
 Madagascar
-
 Malaysia
-
 Malta
Malta
-
 Mauritius
-
 Mexico
-
 Moldova
-
 Mongolia
-
 Montenegro
-
 Morocco
-
 Mozambique
-
 Myanmar
-
 Namibia
-
 Nepal
Nepal
-
 Netherlands
-
 New Zealand
-
 Nigeria
-
 North Macedonia
-
 Norway
-
 Oman
Oman
-
 Pakistan
-
 Palestine
-
 Panama
-
 Papua New Guinea
-
 Paraguay
-
 Peru
Peru
-
 Philippines
-
 Poland
-
 Portugal
-
 Puerto Rico
-
 Qatar
Qatar
-
 Reunion
-
 Romania
-
 Rwanda
-
 Saudi Arabia
-
 Serbia
-
 Singapore
-
 Slovakia
-
 Slovenia
-
 Somalia
-
 South Africa
-
 Spain
Spain
-
 Sri Lanka
-
 Sweden
-
 Switzerland
-
 Syria
Syria
-
 Taiwan
-
 Tajikistan
-
 Tanzania
-
 Thailand
-
 Trinidad and Tobago
-
 Tunisia
-
 Turkey
-
 UAE
UAE
-
 Uganda
-
 Ukraine
-
 United Kingdom
-
United States
-
 Uruguay
-
 Uzbekistan
-
 Venezuela
-
 Vietnam
-
 Yemen
Yemen
-
 Zambia
-
 Zimbabwe
- Forex
- Crypto
