
Intuit stock price forecast: Rangebound outlook persists as INTU jumps 3.00%

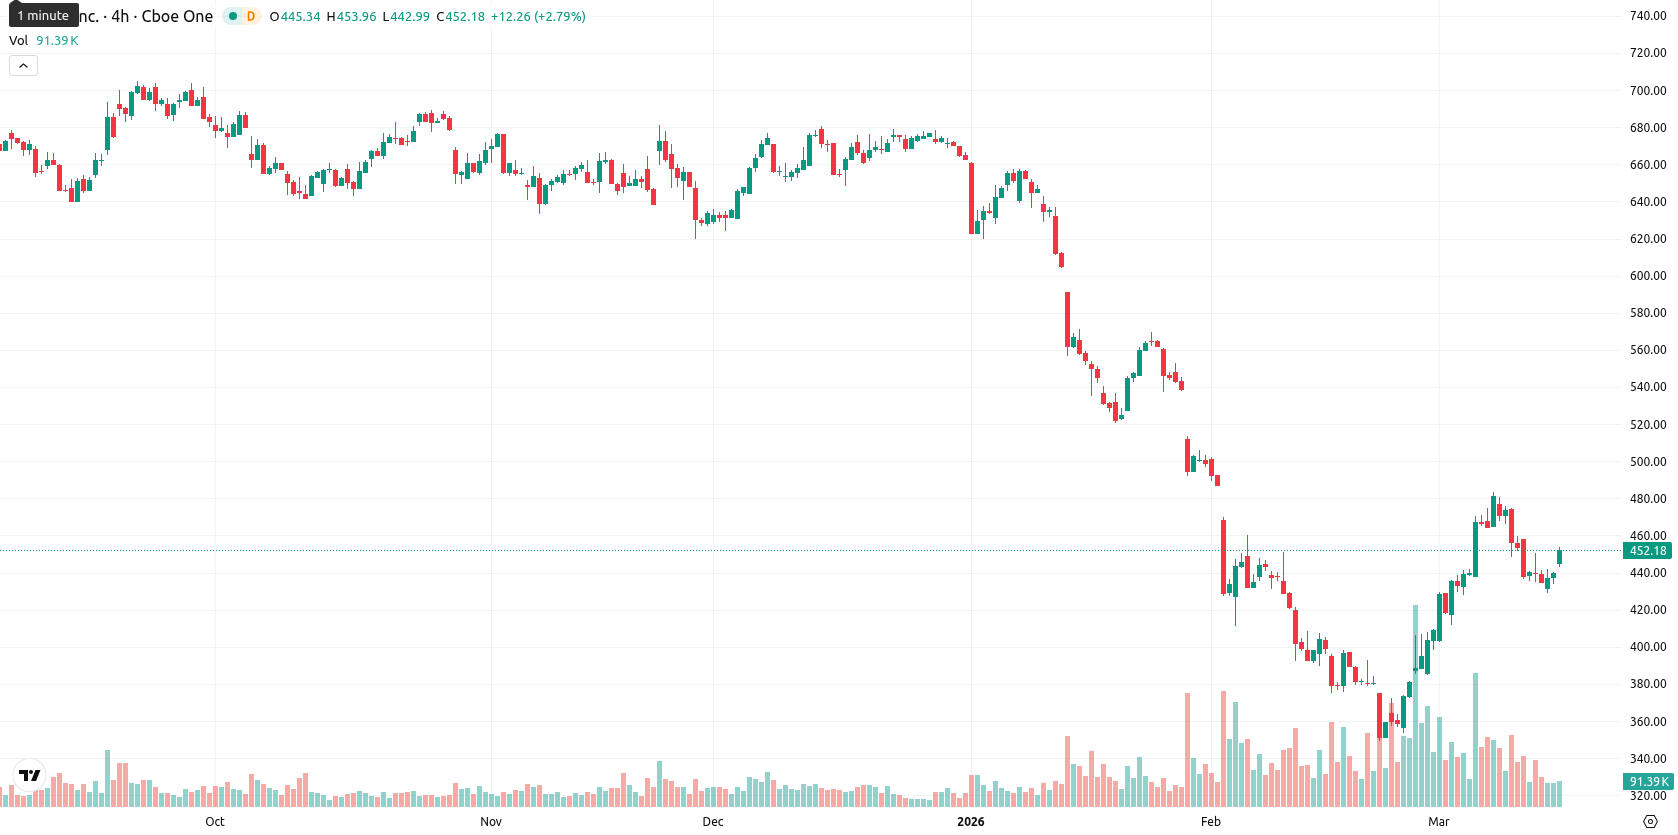
Intuit Inc. (INTU) is trading at $453.13, up 3.00% on the day. The price is holding above both the MA-20 ($415.81) and the Ichimoku Kijun ($416.10), reflecting short-term buying pressure and establishing immediate technical support.
Highlights
- Intuit plans to exhaust its remaining $3.5 billion buyback authorization by the end of fiscal 2026, accelerating share repurchases following a 40% year-over-year increase in the first half.
- Executives have canceled all active pre-scheduled 10b5-1 stock sales, signaling confidence amid a perceived valuation disconnect, while maintaining a quarterly dividend with a 1.1% yield.
- Technically, INTU shows short-term buying momentum but medium- to long-term bearish trends, with sideways price action expected in the $435–$465 range and low odds of a sustained rally.
Share buybacks ramp up as leadership cites undervalued stock
Intuit has accelerated its share repurchase program, planning to utilize up to $3.5 billion still available under its current authorization by the close of fiscal year 2026. The company’s founder and executive leadership have terminated all active pre-scheduled 10b5-1 stock sale plans, citing a disconnect between the current share price and Intuit's fundamental value. Additionally, Intuit recently declared a quarterly dividend of $1.20 per share, payable on April 17, 2026, with an ex-dividend date of April 9, 2026 and an annualized yield of 1.1%. The company repurchased $1.8 billion in shares during the first half of the 2026 fiscal year, a 40% increase over the same period last year.
Intraday strength contrasts with sustained resistance and bearish momentum
INTU remains above immediate moving average supports (MA-20 and Ichimoku Kijun) but is trading below both the MA-50 ($489.24) and MA-200 ($649.01), underscoring persistent medium- and long-term resistance levels. Momentum indicators are mixed: MACD (D1: Strong Sell) and ADX (D1: Sell, 38.47) signal a strong downside bias, whereas BBP reflects overbought conditions and active buyer pressure intraday. RSI and CCI currently show sell or neutral readings, while Stoch RSI is near overbought, and the Awesome Oscillator remains neutral. Today’s session opened with a gap up from $439.94 to $449.52, and the price is trending near session highs amid elevated volatility, highlighting a divergence between daily weakness and strong intraday momentum.
Limited upside as consolidation persists near resistance levels
Over the next five trading days, INTU is likely to remain within a typical volatility band of $435 to $465 as consolidation continues below significant resistance. The probability of additional upside is limited (under 20%), making a short-term pullback more likely. Sideways trading is the baseline scenario, while a bullish breakout would require sustained movement above $465 on renewed intraday momentum. Should the price fall below the $435–$440 range, a deeper correction could develop in alignment with medium- and long-term bearish momentum.
Earlier, analysts noted that Intuit was exhibiting a weak short-term rebound amid persistent medium- and long-term bearish trends. The current analysis highlights that, despite recent buybacks and executive confidence, continued resistance at higher moving averages and mixed momentum signals suggest that traders should closely monitor for a potential downside break below the $435–$440 support range.


-
 Afghanistan
-
 Albania
-
 Algeria
-
 Angola
-
 Argentina
-
 Armenia
-
 Australia
-
 Austria
-
 Azerbaijan
-
 Bahamas
-
 Bahrain
-
 Bangladesh
-
 Belarus
-
 Belgium
-
 Bolivia
-
 Botswana
-
 Brazil
-
 Brunei
-
 Bulgaria
-
 Cambodia
-
 Cameroon
-
 Canada
-
 Chile
Chile
-
 China
China
-
 Colombia
-
 Congo
Congo
-
 Costa Rica
-
 Cote d'Ivoire
-
 Croatia
-
 Cuba
Cuba
-
 Cyprus
-
 Czechia
-
 DR Congo
-
 Denmark
-
 Dominican Republic
-
 Ecuador
-
 Egypt
Egypt
-
 El Salvador
-
 Estonia
-
 Eswatini
-
 Ethiopia
-
 Finland
-
 France
-
 Georgia
-
 Germany
-
 Ghana
Ghana
-
 Greece
-
 Haiti
Haiti
-
 Hong Kong
-
 Hungary
-
 India
India
-
 Indonesia
-
 Iran, Islamic republic
-
 Iraq
Iraq
-
 Ireland
-
 Israel
-
 Italy
Italy
-
 Jamaica
-
 Japan
Japan
-
 Jordan
-
 Kazakhstan
-
 Kenya
Kenya
-
 Korea
Korea
-
 Kuwait
-
 Kyrgyzstan
-
 Laos
Laos
-
 Latvia
-
 Lebanon
-
 Lesotho
-
 Libya
Libya
-
 Lithuania
-
 Luxembourg
-
 Madagascar
-
 Malaysia
-
 Malta
Malta
-
 Mauritius
-
 Mexico
-
 Moldova
-
 Mongolia
-
 Montenegro
-
 Morocco
-
 Mozambique
-
 Myanmar
-
 Namibia
-
 Nepal
Nepal
-
 Netherlands
-
 New Zealand
-
 Nigeria
-
 North Macedonia
-
 Norway
-
 Oman
Oman
-
 Pakistan
-
 Palestine
-
 Panama
-
 Papua New Guinea
-
 Paraguay
-
 Peru
Peru
-
 Philippines
-
 Poland
-
 Portugal
-
 Puerto Rico
-
 Qatar
Qatar
-
 Reunion
-
 Romania
-
 Rwanda
-
 Saudi Arabia
-
 Serbia
-
 Singapore
-
 Slovakia
-
 Slovenia
-
 Somalia
-
 South Africa
-
 Spain
Spain
-
 Sri Lanka
-
 Sweden
-
 Switzerland
-
 Syria
Syria
-
 Taiwan
-
 Tajikistan
-
 Tanzania
-
 Thailand
-
 Trinidad and Tobago
-
 Tunisia
-
 Turkey
-
 UAE
UAE
-
 Uganda
-
 Ukraine
-
 United Kingdom
-
United States
-
 Uruguay
-
 Uzbekistan
-
 Venezuela
-
 Vietnam
-
 Yemen
Yemen
-
 Zambia
-
 Zimbabwe
- Forex
- Crypto
