
Robinhood under pressure — Robinhood growth narrative faces technical resistance

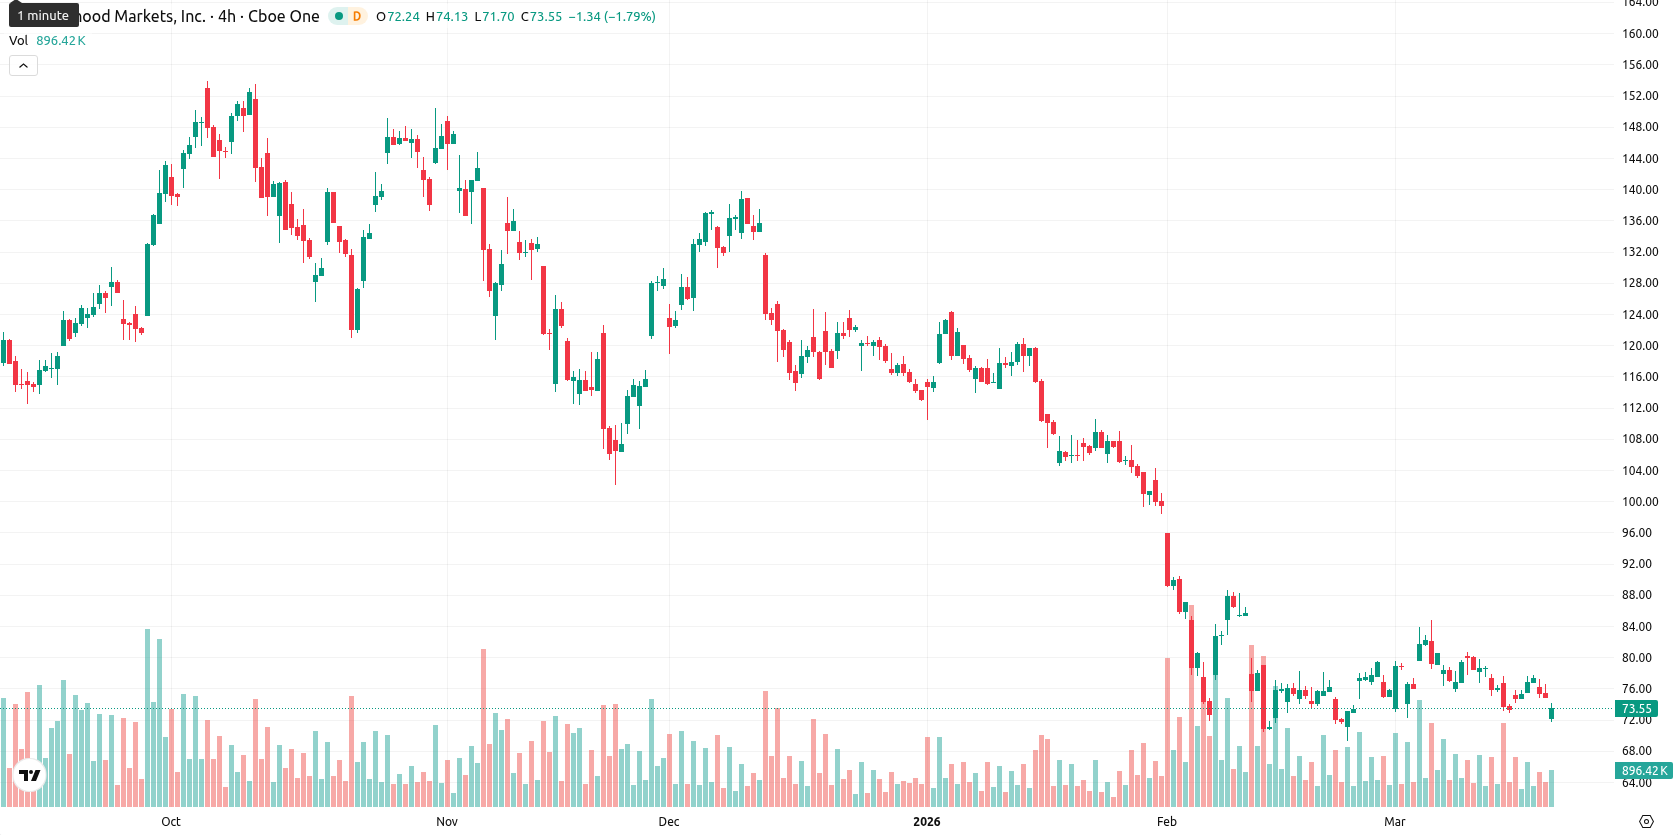
Robinhood Markets Inc (HOOD) is currently trading at $73.19, down from the prior close by $X.XX (Y.YY%), and has declined $Z.ZZ (W.WW%) intraday since the market open. The price has seen continuous selling within today's range, pressured by persistent downside momentum following a promotional statement about premium perks from RobinhoodApp and recent product and banking announcements.
Highlights
- Price remains in a well-defined downtrend with sellers controlling momentum across short, medium, and long timeframes.
- Technical indicators collectively signal strong bearishness, with oversold readings and continued downside momentum after a gap-down open.
- Projected five-day trading range is $69.75 to $76.13, with resistance at $78.72 and a low probability of a rebound.
Product launches and banking growth fuel Robinhood’s diversification bid
RobinhoodApp's recent statement highlights the launch of premium perks in their product lineup, signaling an upbeat and promotional push designed to attract users seeking additional benefits. This aligns with Robinhood's recent developments, including the launch of Robinhood Social for community engagement, the unveiling of a premium platinum credit card, and growing its banking division to surpass $1 billion in deposits. The company's ongoing focus on product innovation and diversification, such as investing in startups and expanding membership-driven revenues, adds to its broader growth narrative.
Technical resistance holds as bearish signals and downside momentum build
The current price of $73.19 trades below the MA-20 at $76.91, the MA-50 at $89.72, and the MA-200 at $107.82, confirming downside momentum across all periods. The nearest resistance is at $78.72, with sellers dominating and strong pressure maintaining a bearish outlook, as indicated by negative MACD and oversold RSI conditions. The expected 5-day price range is $69.75 to $76.13, with the trend bias remaining clearly negative. A reversal would require a move above resistance, while a fall below $69.75 could accelerate further declines.
Earlier, analysts noted that Robinhood was under persistent selling pressure with a cautious outlook. This article adds a new dimension by examining how recent corporate developments could influence sentiment, with traders advised to watch for a shift in momentum as a potential catalyst for the next directional move.


Latest Robinhood News


-
 Afghanistan
-
 Albania
-
 Algeria
-
 Angola
-
 Argentina
-
 Armenia
-
 Australia
-
 Austria
-
 Azerbaijan
-
 Bahamas
-
 Bahrain
-
 Bangladesh
-
 Belarus
-
 Belgium
-
 Bolivia
-
 Botswana
-
 Brazil
-
 Brunei
-
 Bulgaria
-
 Cambodia
-
 Cameroon
-
 Canada
-
 Chile
Chile
-
 China
China
-
 Colombia
-
 Congo
Congo
-
 Costa Rica
-
 Cote d'Ivoire
-
 Croatia
-
 Cuba
Cuba
-
 Cyprus
-
 Czechia
-
 DR Congo
-
 Denmark
-
 Dominican Republic
-
 Ecuador
-
 Egypt
Egypt
-
 El Salvador
-
 Estonia
-
 Eswatini
-
 Ethiopia
-
 Finland
-
 France
-
 Georgia
-
 Germany
-
 Ghana
Ghana
-
 Greece
-
 Haiti
Haiti
-
 Hong Kong
-
 Hungary
-
 India
India
-
 Indonesia
-
 Iran, Islamic republic
-
 Iraq
Iraq
-
 Ireland
-
 Israel
-
 Italy
Italy
-
 Jamaica
-
 Japan
Japan
-
 Jordan
-
 Kazakhstan
-
 Kenya
Kenya
-
 Korea
Korea
-
 Kuwait
-
 Kyrgyzstan
-
 Laos
Laos
-
 Latvia
-
 Lebanon
-
 Lesotho
-
 Libya
Libya
-
 Lithuania
-
 Luxembourg
-
 Madagascar
-
 Malaysia
-
 Malta
Malta
-
 Mauritius
-
 Mexico
-
 Moldova
-
 Mongolia
-
 Montenegro
-
 Morocco
-
 Mozambique
-
 Myanmar
-
 Namibia
-
 Nepal
Nepal
-
 Netherlands
-
 New Zealand
-
 Nigeria
-
 North Macedonia
-
 Norway
-
 Oman
Oman
-
 Pakistan
-
 Palestine
-
 Panama
-
 Papua New Guinea
-
 Paraguay
-
 Peru
Peru
-
 Philippines
-
 Poland
-
 Portugal
-
 Puerto Rico
-
 Qatar
Qatar
-
 Reunion
-
 Romania
-
 Rwanda
-
 Saudi Arabia
-
 Serbia
-
 Singapore
-
 Slovakia
-
 Slovenia
-
 Somalia
-
 South Africa
-
 Spain
Spain
-
 Sri Lanka
-
 Sweden
-
 Switzerland
-
 Syria
Syria
-
 Taiwan
-
 Tajikistan
-
 Tanzania
-
 Thailand
-
 Trinidad and Tobago
-
 Tunisia
-
 Turkey
-
 UAE
UAE
-
 Uganda
-
 Ukraine
-
 United Kingdom
-
United States
-
 Uruguay
-
 Uzbekistan
-
 Venezuela
-
 Vietnam
-
 Yemen
Yemen
-
 Zambia
-
 Zimbabwe
- Forex
- Crypto
