
American Airlines stock price forecast: Sideways action likely as AAL drops 3.86%

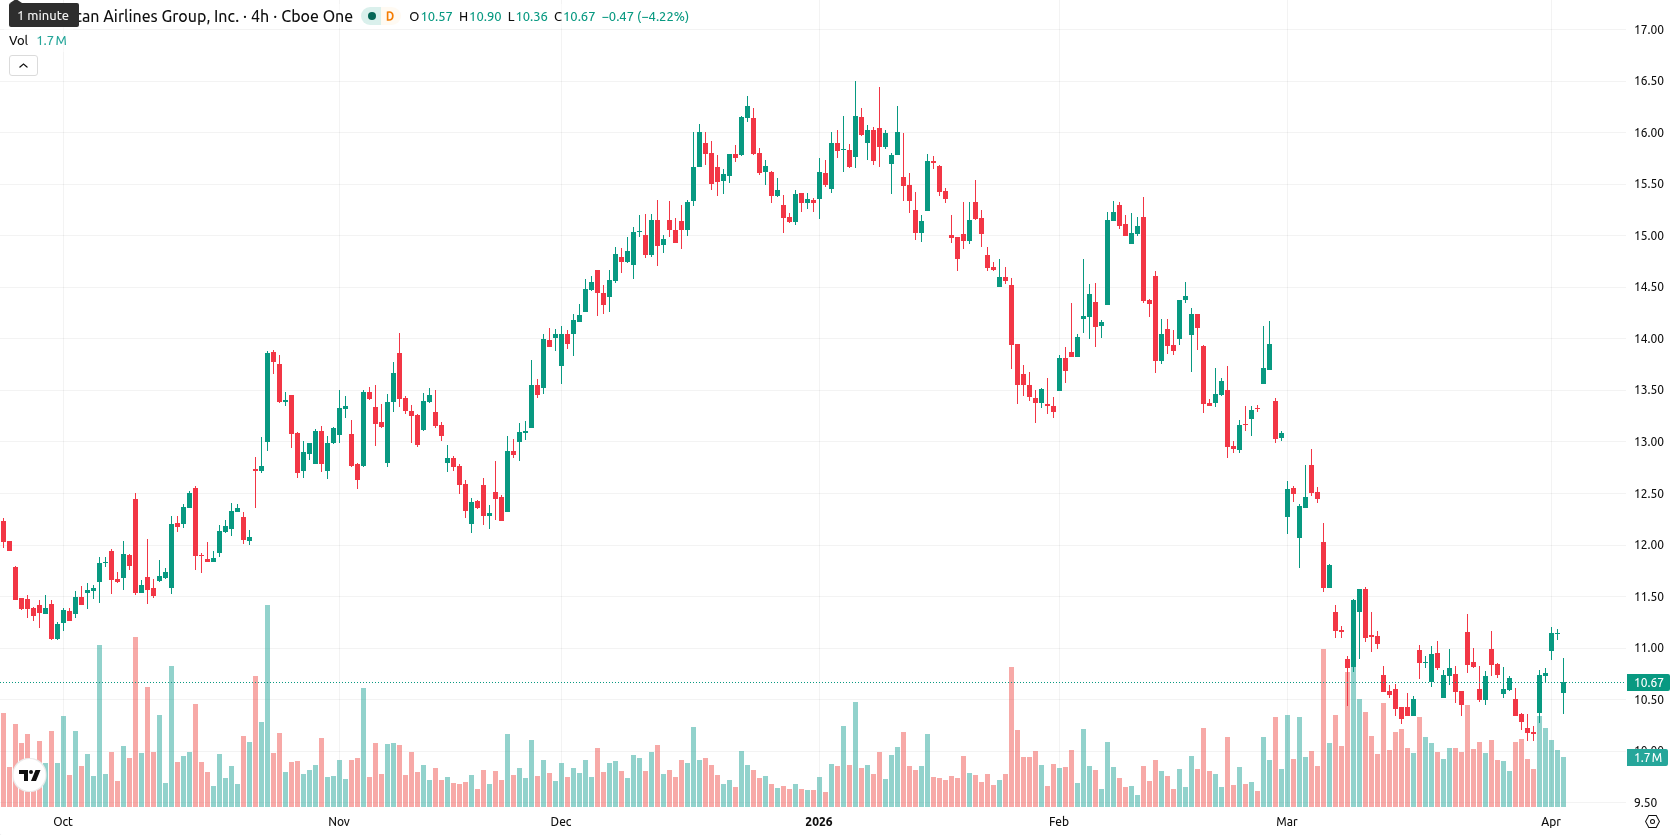
American Airlines Group (AAL) is trading at $10.70, which is just below the SMA-20 at $10.81 and remains well under both the SMA-50 at $12.65 and the SMA-200 at $12.90. This setup indicates that AAL is experiencing continued short- and medium-term selling pressure and is maintaining a bearish technical profile, with the Ichimoku Kijun at $12.13 acting as immediate resistance.
Highlights
- AAL remains in a bearish technical structure, trading below major moving averages amid sustained selling pressure.
- Mixed momentum signals show dominant bearish indicators offset by some short-term buyer support, creating near-term uncertainty.
- Projected five-day trading range is $10.30 to $11.00, with less than a 20% chance of price recovery and downside risk prevailing.
Conflicting momentum signals as intraday range signals low volatility
Momentum signals show a mixed picture: the D1 MACD gives a strong sell signal and the ADX indicates persistent selling pressure, while the RSI at 46.31 is neutral but skewed toward weakness. The Stoch RSI is overbought at 100, and the CCI points to mild buying conditions, highlighting divergence among the oscillators. BBP on the D1 timeframe remains positive, supporting short-term buyer dominance, but the Awesome Oscillator stays neutral and does not support the current trend. After opening at $10.47, AAL slipped 3.86% on the day, with intraday action confined to a narrow range between $10.45 and $10.55, suggesting low volatility and sustained intraday pressure consistent with ongoing negative momentum from the MACD and ADX, despite conflicting indicators among oscillators.
Downside risk prevails as range trading dominates outlook
Over the next five trading days, AAL is expected to trade within a typical volatility band of $10.30 to $11.00, close to current levels. The likelihood of a price increase is low (less than 20%), with a further decline being more probable given bearish or neutral signals from the weekly MA-50, MA-100, MA-200, RSI, MACD, and ADX. The baseline scenario assumes continued sideways trading inside this corridor. A bullish outlook would require a break and close above the immediate resistance at $12.13, while a clear move below $10.30 would confirm renewed downside momentum.
Earlier, analysts noted that American Airlines shares were under persistent bearish momentum, with only minor indications of short-term buyer interest. The current setup reinforces this outlook, as ongoing downside bias and conflicting momentum signals mean traders should closely monitor the $10.30 level as a critical threshold for renewed selling pressure in the days ahead.


Latest American Airlines News


-
 Afghanistan
-
 Albania
-
 Algeria
-
 Angola
-
 Argentina
-
 Armenia
-
 Australia
-
 Austria
-
 Azerbaijan
-
 Bahamas
-
 Bahrain
-
 Bangladesh
-
 Belarus
-
 Belgium
-
 Bolivia
-
 Botswana
-
 Brazil
-
 Brunei
-
 Bulgaria
-
 Cambodia
-
 Cameroon
-
 Canada
-
 Chile
Chile
-
 China
China
-
 Colombia
-
 Congo
Congo
-
 Costa Rica
-
 Cote d'Ivoire
-
 Croatia
-
 Cuba
Cuba
-
 Cyprus
-
 Czechia
-
 DR Congo
-
 Denmark
-
 Dominican Republic
-
 Ecuador
-
 Egypt
Egypt
-
 El Salvador
-
 Estonia
-
 Eswatini
-
 Ethiopia
-
 Finland
-
 France
-
 Georgia
-
 Germany
-
 Ghana
Ghana
-
 Greece
-
 Haiti
Haiti
-
 Hong Kong
-
 Hungary
-
 India
India
-
 Indonesia
-
 Iran, Islamic republic
-
 Iraq
Iraq
-
 Ireland
-
 Israel
-
 Italy
Italy
-
 Jamaica
-
 Japan
Japan
-
 Jordan
-
 Kazakhstan
-
 Kenya
Kenya
-
 Korea
Korea
-
 Kuwait
-
 Kyrgyzstan
-
 Laos
Laos
-
 Latvia
-
 Lebanon
-
 Lesotho
-
 Libya
Libya
-
 Lithuania
-
 Luxembourg
-
 Madagascar
-
 Malaysia
-
 Malta
Malta
-
 Mauritius
-
 Mexico
-
 Moldova
-
 Mongolia
-
 Montenegro
-
 Morocco
-
 Mozambique
-
 Myanmar
-
 Namibia
-
 Nepal
Nepal
-
 Netherlands
-
 New Zealand
-
 Nigeria
-
 North Macedonia
-
 Norway
-
 Oman
Oman
-
 Pakistan
-
 Palestine
-
 Panama
-
 Papua New Guinea
-
 Paraguay
-
 Peru
Peru
-
 Philippines
-
 Poland
-
 Portugal
-
 Puerto Rico
-
 Qatar
Qatar
-
 Reunion
-
 Romania
-
 Rwanda
-
 Saudi Arabia
-
 Serbia
-
 Singapore
-
 Slovakia
-
 Slovenia
-
 Somalia
-
 South Africa
-
 Spain
Spain
-
 Sri Lanka
-
 Sweden
-
 Switzerland
-
 Syria
Syria
-
 Taiwan
-
 Tajikistan
-
 Tanzania
-
 Thailand
-
 Trinidad and Tobago
-
 Tunisia
-
 Turkey
-
 UAE
UAE
-
 Uganda
-
 Ukraine
-
 United Kingdom
-
United States
-
 Uruguay
-
 Uzbekistan
-
 Venezuela
-
 Vietnam
-
 Yemen
Yemen
-
 Zambia
-
 Zimbabwe
- Forex
- Crypto
