
NuCana stock price forecast: $2.05–$2.40 range as NCNA gains 18.42%

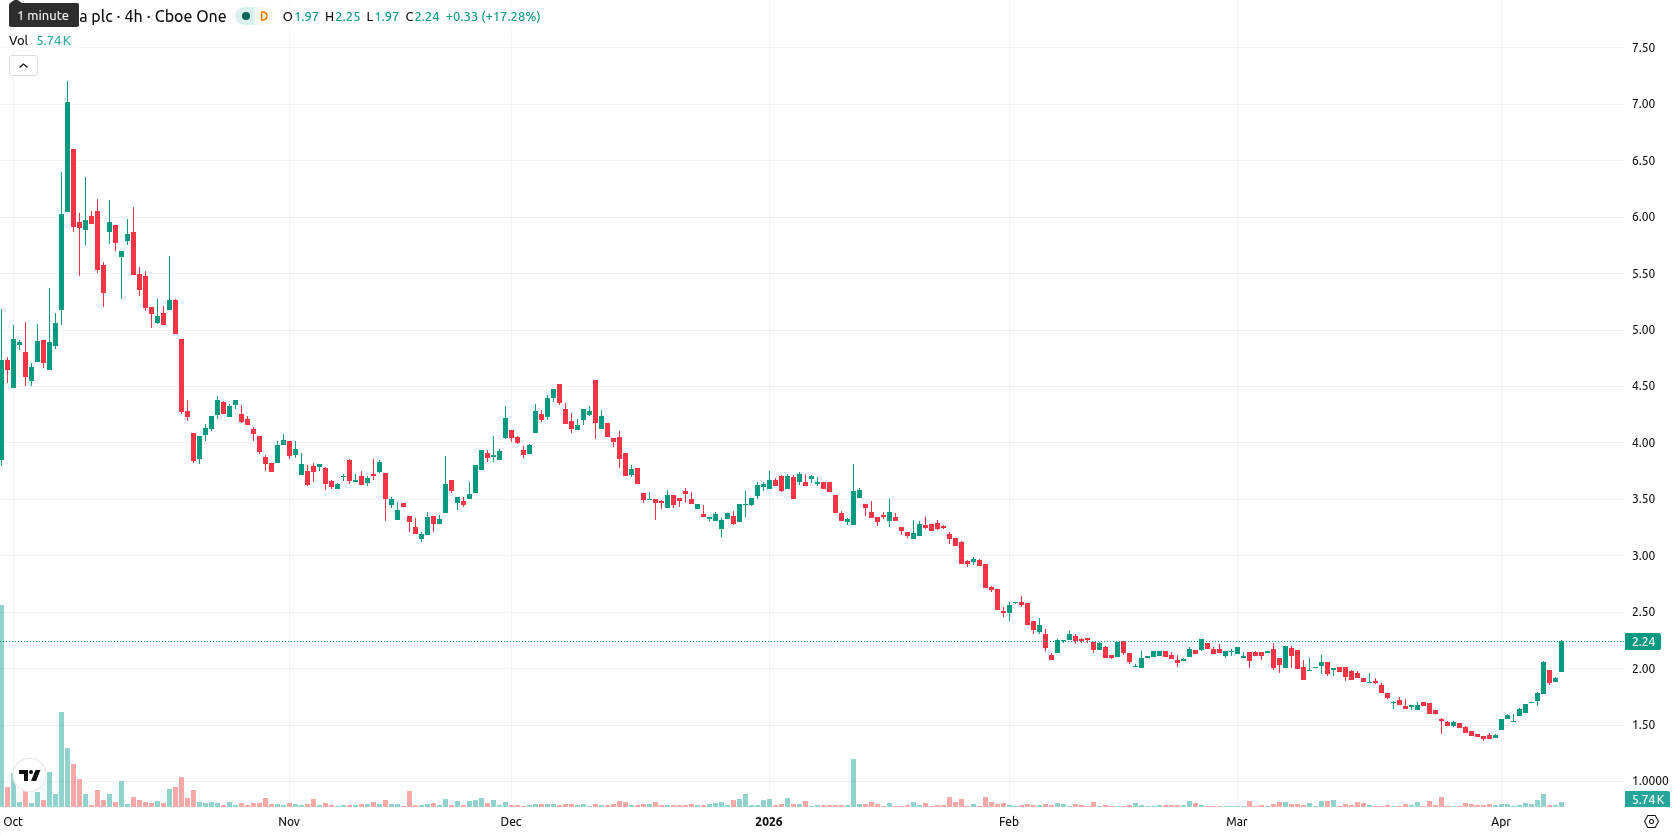
NuCana plc ADR (NCNA) is trading at $2.25, currently above both the MA-20 ($1.70) and MA-50 ($2.02), but well below the MA-200 ($4.65). This moving average setup reflects short-term and medium-term bullish momentum, while the longer-term trend remains bearish, with the Ichimoku Kijun at $1.78 acting as immediate support.
Highlights
- NCNA shows short- and medium-term bullish momentum but remains in a long-term bearish trend.
- Momentum and overbought indicators are flashing warning signals, suggesting the recent rally may soon stall.
- Price is projected to move sideways between $2.05 and $2.40 over the next week, with pullback or consolidation likely.
Momentum divergence as buyers test overbought territory
Momentum indicators show mixed signals: D1 ADX is strong and bullish, but MACD shows a strong sell, indicating possible divergence. Both Stoch RSI (83.36) and CCI (78.66) are in overbought territory, while RSI (53.33) remains in the neutral-bullish range. BBP reflects ongoing buyer dominance for the session. The Awesome Oscillator is neutral and does not confirm the current uptrend. The price surged $0.35 (up 18.42%) today with a small opening gap, sits near the top of today’s range ($1.92 – $2.16), and intraday volatility is high. The tone since the open has been strong, with buyers driving prices toward session highs, but momentum and overbought readings are diverging.
Consolidation expected as upside probability diminishes
For the next 5 trading days, the expected normalized range is $2.05 – $2.40, representing a typical volatility band relative to current levels. The probability of a further price increase is very low (less than 20%) based on W1 RSI, MACD, and moving averages, making a pullback or consolidation more likely. The baseline scenario is sideways movement between $2.05 and $2.40. A bullish breakout could lift NCNA above $2.40 if buying pressure persists, while a bearish scenario would see a drop below $2.05 in case selling resumes or momentum fades.
Previously it was reported that NuCana was under persistent bearish pressure, with short-term positive momentum offset by broader signals favoring downside risk. The current technical picture reinforces this cautious outlook, with overbought readings and mixed momentum highlighting the likelihood of near-term consolidation or pullback; traders should closely monitor the $2.05 level as critical support in the days ahead.


Latest NuCana News


-
 Afghanistan
-
 Albania
-
 Algeria
-
 Angola
-
 Argentina
-
 Armenia
-
 Australia
-
 Austria
-
 Azerbaijan
-
 Bahamas
-
 Bahrain
-
 Bangladesh
-
 Belarus
-
 Belgium
-
 Bolivia
-
 Botswana
-
 Brazil
-
 Brunei
-
 Bulgaria
-
 Cambodia
-
 Cameroon
-
 Canada
-
 Chile
Chile
-
 China
China
-
 Colombia
-
 Congo
Congo
-
 Costa Rica
-
 Cote d'Ivoire
-
 Croatia
-
 Cuba
Cuba
-
 Cyprus
-
 Czechia
-
 DR Congo
-
 Denmark
-
 Dominican Republic
-
 Ecuador
-
 Egypt
Egypt
-
 El Salvador
-
 Estonia
-
 Eswatini
-
 Ethiopia
-
 Finland
-
 France
-
 Georgia
-
 Germany
-
 Ghana
Ghana
-
 Greece
-
 Haiti
Haiti
-
 Hong Kong
-
 Hungary
-
 India
India
-
 Indonesia
-
 Iran, Islamic republic
-
 Iraq
Iraq
-
 Ireland
-
 Israel
-
 Italy
Italy
-
 Jamaica
-
 Japan
Japan
-
 Jordan
-
 Kazakhstan
-
 Kenya
Kenya
-
 Korea
Korea
-
 Kuwait
-
 Kyrgyzstan
-
 Laos
Laos
-
 Latvia
-
 Lebanon
-
 Lesotho
-
 Libya
Libya
-
 Lithuania
-
 Luxembourg
-
 Madagascar
-
 Malaysia
-
 Malta
Malta
-
 Mauritius
-
 Mexico
-
 Moldova
-
 Mongolia
-
 Montenegro
-
 Morocco
-
 Mozambique
-
 Myanmar
-
 Namibia
-
 Nepal
Nepal
-
 Netherlands
-
 New Zealand
-
 Nigeria
-
 North Macedonia
-
 Norway
-
 Oman
Oman
-
 Pakistan
-
 Palestine
-
 Panama
-
 Papua New Guinea
-
 Paraguay
-
 Peru
Peru
-
 Philippines
-
 Poland
-
 Portugal
-
 Puerto Rico
-
 Qatar
Qatar
-
 Reunion
-
 Romania
-
 Rwanda
-
 Saudi Arabia
-
 Serbia
-
 Singapore
-
 Slovakia
-
 Slovenia
-
 Somalia
-
 South Africa
-
 Spain
Spain
-
 Sri Lanka
-
 Sweden
-
 Switzerland
-
 Syria
Syria
-
 Taiwan
-
 Tajikistan
-
 Tanzania
-
 Thailand
-
 Trinidad and Tobago
-
 Tunisia
-
 Turkey
-
 UAE
UAE
-
 Uganda
-
 Ukraine
-
 United Kingdom
-
United States
-
 Uruguay
-
 Uzbekistan
-
 Venezuela
-
 Vietnam
-
 Yemen
Yemen
-
 Zambia
-
 Zimbabwe
- Forex
- Crypto
