
QUBT stock holds steady as buyers face key resistance overhead

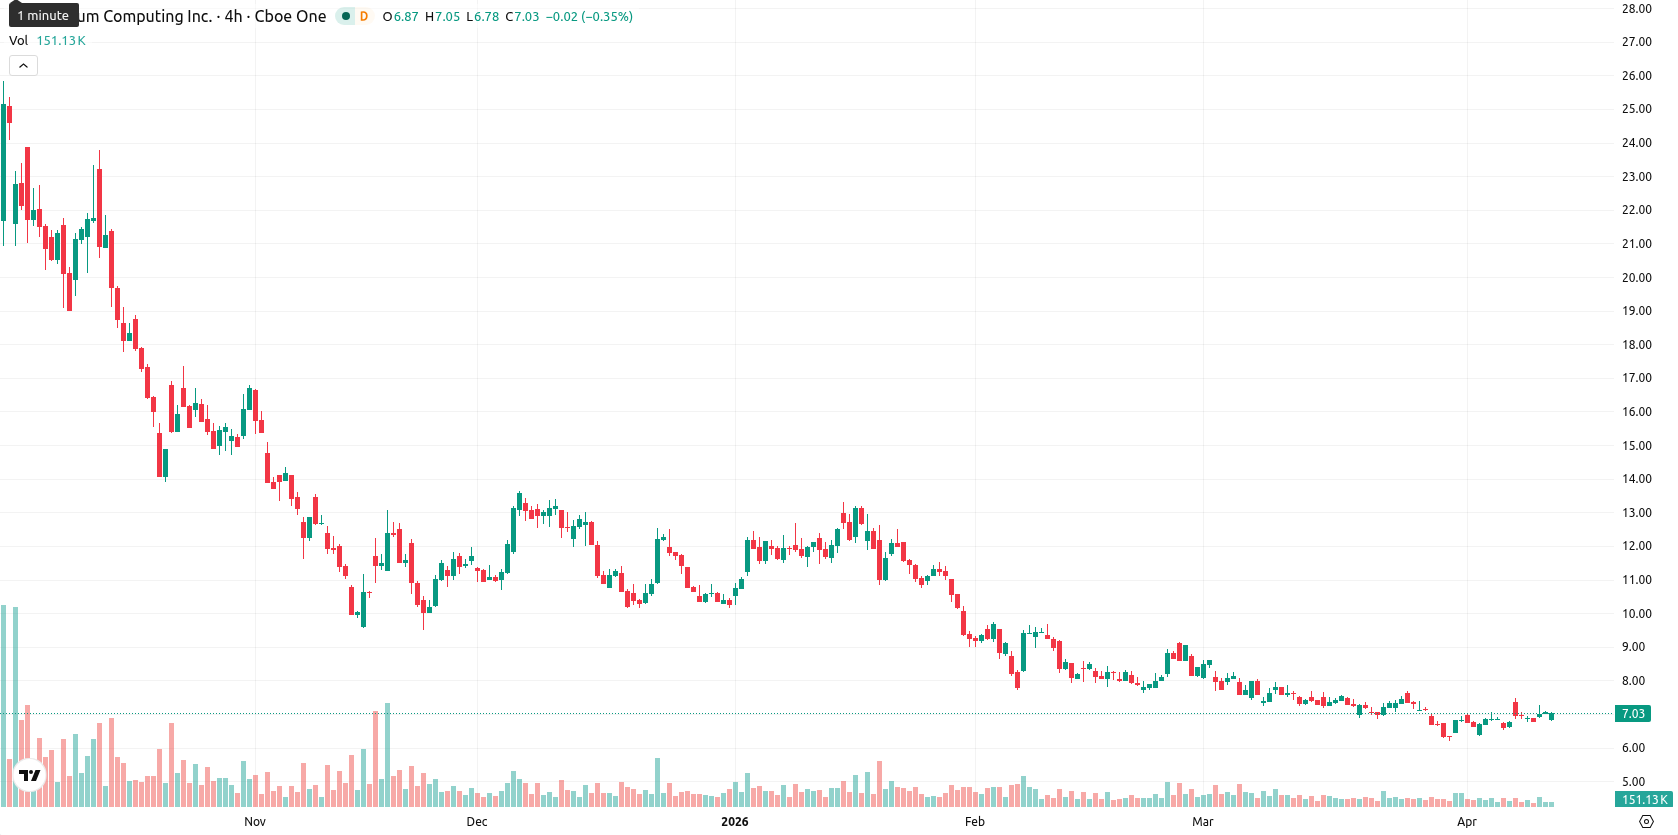
Quantum Computing Inc. (QUBT) is trading at $7.04, slightly down by 0.30% today and sitting just above the 20-day moving average ($7.03), but remaining below the 50-day ($7.87) and 200-day ($13.42) moving averages. This reflects a minor short-term buying interest amid ongoing medium- and long-term selling pressure.
Highlights
- QUBT is trading just above short-term support but remains under pressure from medium- and long-term downtrends.
- Technical momentum indicators show weak to negative bias, while intraday oscillators signal overbought conditions and potential short-term exhaustion.
- Price is expected to remain range-bound between $6.70 and $7.38 with downside risk prevailing and limited probability of a breakout above resistance.
Resistance at kijun as oscillators flash mixed momentum signals
Technically, QUBT faces immediate resistance at the Ichimoku Kijun level ($7.13), while staying just above its MA-20 but clearly below the MA-50 and MA-200 — signifying continued medium- and long-term weakness. The MACD generates a strong sell signal and the ADX also points to weak trend intensity, while RSI stands muted at 46 and CCI is neutral; in contrast, Stoch RSI is flagged as overbought (100), indicating the potential for near-term exhaustion. BBP is firmly in strong buy territory, suggesting buyers dominate current intraday action despite low volatility and a lack of meaningful opening gaps, as price trades at the upper end of today's range ($6.79–$7.04). Overall, mixed signals from oscillators and momentum measures call for cautious interpretation of intraday strength.
Downside risk persists as volatility band limits upside
In the short term, QUBT is likely to fluctuate within a volatility band of $6.70 to $7.38, aligning with recent modest price swings. The probability of a price increase remains very low (less than 20%), and further downside risk is present. The baseline scenario is a continuation of sideways trading near current levels. A move above $7.13 would indicate bullish momentum, while a drop below $6.70 would deepen the present downtrend.
Previously it was reported that Quantum Computing Inc. continued to show persistent bearish technical signals with downside risk dominating the near-term outlook. The latest analysis reinforces this assessment, urging traders to monitor $7.13 as a key resistance level whose breach could shift sentiment, while a sustained drop below $6.70 may accelerate the prevailing downward trend.


Latest Quantum Computing News


-
 Afghanistan
-
 Albania
-
 Algeria
-
 Angola
-
 Argentina
-
 Armenia
-
 Australia
-
 Austria
-
 Azerbaijan
-
 Bahamas
-
 Bahrain
-
 Bangladesh
-
 Belarus
-
 Belgium
-
 Bolivia
-
 Botswana
-
 Brazil
-
 Brunei
-
 Bulgaria
-
 Cambodia
-
 Cameroon
-
 Canada
-
 Chile
Chile
-
 China
China
-
 Colombia
-
 Congo
Congo
-
 Costa Rica
-
 Cote d'Ivoire
-
 Croatia
-
 Cuba
Cuba
-
 Cyprus
-
 Czechia
-
 DR Congo
-
 Denmark
-
 Dominican Republic
-
 Ecuador
-
 Egypt
Egypt
-
 El Salvador
-
 Estonia
-
 Eswatini
-
 Ethiopia
-
 Finland
-
 France
-
 Georgia
-
 Germany
-
 Ghana
Ghana
-
 Greece
-
 Haiti
Haiti
-
 Hong Kong
-
 Hungary
-
 India
India
-
 Indonesia
-
 Iran, Islamic republic
-
 Iraq
Iraq
-
 Ireland
-
 Israel
-
 Italy
Italy
-
 Jamaica
-
 Japan
Japan
-
 Jordan
-
 Kazakhstan
-
 Kenya
Kenya
-
 Korea
Korea
-
 Kuwait
-
 Kyrgyzstan
-
 Laos
Laos
-
 Latvia
-
 Lebanon
-
 Lesotho
-
 Libya
Libya
-
 Lithuania
-
 Luxembourg
-
 Madagascar
-
 Malaysia
-
 Malta
Malta
-
 Mauritius
-
 Mexico
-
 Moldova
-
 Mongolia
-
 Montenegro
-
 Morocco
-
 Mozambique
-
 Myanmar
-
 Namibia
-
 Nepal
Nepal
-
 Netherlands
-
 New Zealand
-
 Nigeria
-
 North Macedonia
-
 Norway
-
 Oman
Oman
-
 Pakistan
-
 Palestine
-
 Panama
-
 Papua New Guinea
-
 Paraguay
-
 Peru
Peru
-
 Philippines
-
 Poland
-
 Portugal
-
 Puerto Rico
-
 Qatar
Qatar
-
 Reunion
-
 Romania
-
 Rwanda
-
 Saudi Arabia
-
 Serbia
-
 Singapore
-
 Slovakia
-
 Slovenia
-
 Somalia
-
 South Africa
-
 Spain
Spain
-
 Sri Lanka
-
 Sweden
-
 Switzerland
-
 Syria
Syria
-
 Taiwan
-
 Tajikistan
-
 Tanzania
-
 Thailand
-
 Trinidad and Tobago
-
 Tunisia
-
 Turkey
-
 UAE
UAE
-
 Uganda
-
 Ukraine
-
 United Kingdom
-
United States
-
 Uruguay
-
 Uzbekistan
-
 Venezuela
-
 Vietnam
-
 Yemen
Yemen
-
 Zambia
-
 Zimbabwe
- Forex
- Crypto
