
Quantum Computing stock advances as momentum cools after a swift short-term rally

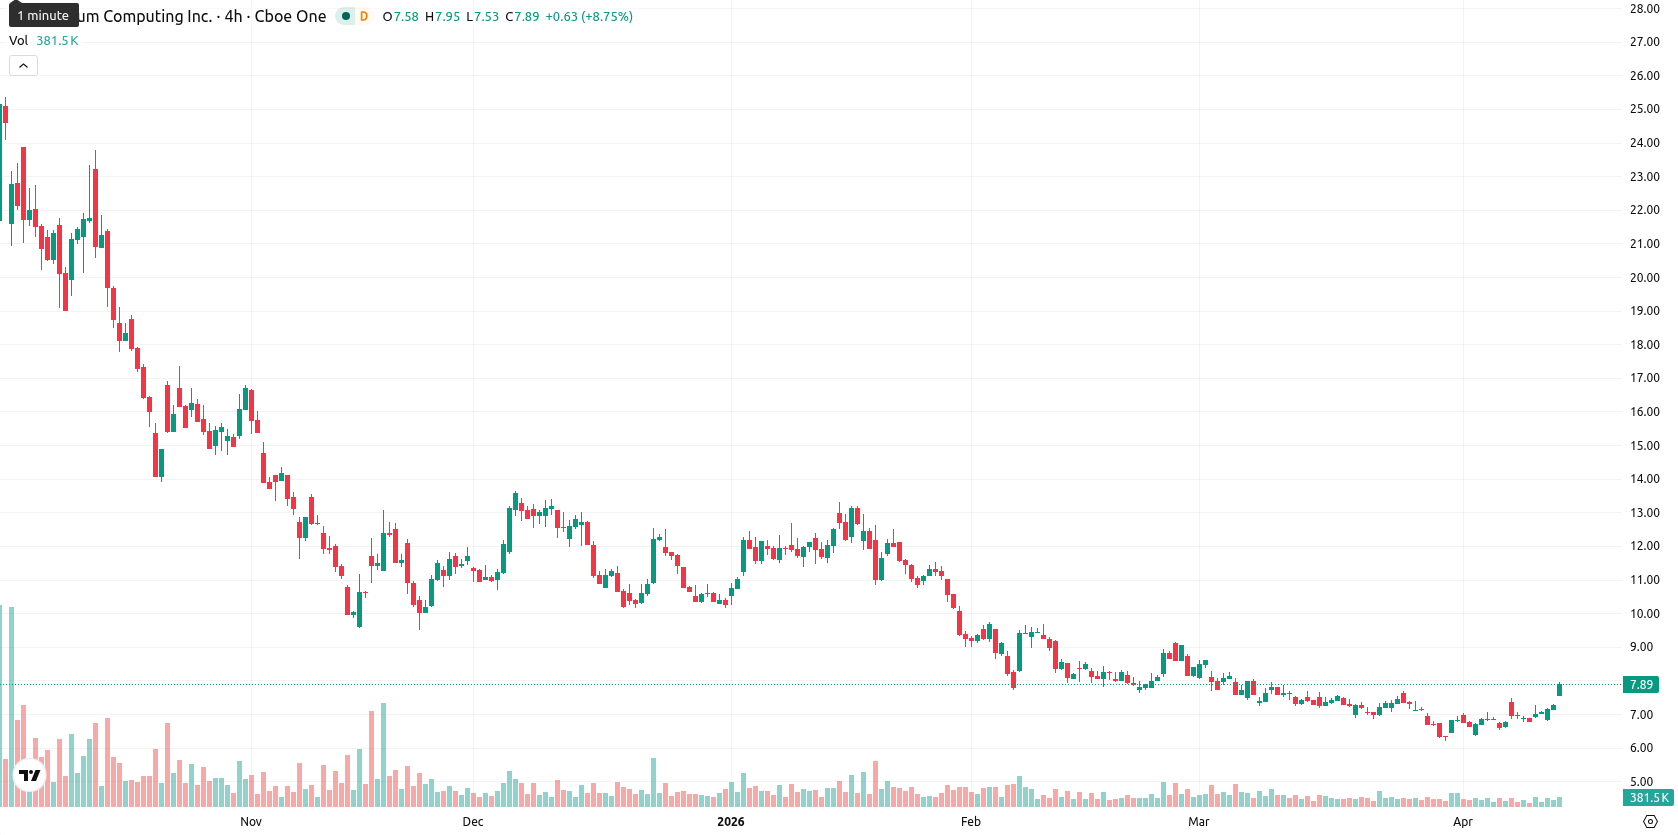
Quantum Computing Inc. (QUBT) is trading at $7.86, up 8.12% today. The asset has moved above the SMA-20 ($7.03) and the SMA-50 ($7.81), but remains well below the SMA-200 ($13.37), suggesting recent bullish momentum is overcoming short- and medium-term resistance, while the longer-term trend remains challenged by seller pressure. The Ichimoku Kijun at $7.11 now acts as immediate support.
Highlights
- QUBT shows recent bullish momentum, trading above short- and medium-term averages but remains in a long-term downtrend.
- Technical signals are mixed, with strong intraday buying and volatility, but daily indicators warn of potential downside risk.
- Expected trading range is $7.10 to $8.10 over five days, with consolidation likely unless $8.10 resistance or $7.11 support is decisively broken.
Mixed momentum signals amid sharp intraday buyer dominance
Momentum signals for QUBT are mixed. The D1 MACD points to strong downside risk, while ADX is weak and leans bearish, indicating limited trend strength. RSI is just below neutral at 49.5, but Stoch RSI is extremely overbought at 100.0, and CCI is neutral yet close to overbought levels on lower timeframes. BBP shows strong buyer dominance intraday, consistent with today's bullish price action. A gap up at the open ($7.60 vs. previous close $7.27), current price near the high, and elevated volatility indicate continued strength toward highs. However, conflicting D1 MACD and RSI readings caution against assuming a sustained breakout.
Consolidation likely as downside risk overtakes rally potential
Over the next five trading days, QUBT is likely to move within a typical volatility band of $7.10 to $8.10 as the market digests recent gains. Near-term signals suggest a less than 20% probability of further price increase, with downside favored as key weekly trend indicators remain bearish. The baseline scenario is for sideways consolidation within this range. A decisive push above $8.10 would signal a bullish breakout, while a breakdown below the $7.11 support could open the door to further declines.
Earlier, analysts noted that Quantum Computing Inc. was experiencing persistent bearish technical signals and downside risks dominating the near-term outlook. While the current rally shows buyers testing resistance, conflicting momentum indicators mean traders should watch for confirmation above $8.10 before expecting a sustained breakout.


Latest Quantum Computing News


-
 Afghanistan
-
 Albania
-
 Algeria
-
 Angola
-
 Argentina
-
 Armenia
-
 Australia
-
 Austria
-
 Azerbaijan
-
 Bahamas
-
 Bahrain
-
 Bangladesh
-
 Belarus
-
 Belgium
-
 Bolivia
-
 Botswana
-
 Brazil
-
 Brunei
-
 Bulgaria
-
 Cambodia
-
 Cameroon
-
 Canada
-
 Chile
Chile
-
 China
China
-
 Colombia
-
 Congo
Congo
-
 Costa Rica
-
 Cote d'Ivoire
-
 Croatia
-
 Cuba
Cuba
-
 Cyprus
-
 Czechia
-
 DR Congo
-
 Denmark
-
 Dominican Republic
-
 Ecuador
-
 Egypt
Egypt
-
 El Salvador
-
 Estonia
-
 Eswatini
-
 Ethiopia
-
 Finland
-
 France
-
 Georgia
-
 Germany
-
 Ghana
Ghana
-
 Greece
-
 Haiti
Haiti
-
 Hong Kong
-
 Hungary
-
 India
India
-
 Indonesia
-
 Iran, Islamic republic
-
 Iraq
Iraq
-
 Ireland
-
 Israel
-
 Italy
Italy
-
 Jamaica
-
 Japan
Japan
-
 Jordan
-
 Kazakhstan
-
 Kenya
Kenya
-
 Korea
Korea
-
 Kuwait
-
 Kyrgyzstan
-
 Laos
Laos
-
 Latvia
-
 Lebanon
-
 Lesotho
-
 Libya
Libya
-
 Lithuania
-
 Luxembourg
-
 Madagascar
-
 Malaysia
-
 Malta
Malta
-
 Mauritius
-
 Mexico
-
 Moldova
-
 Mongolia
-
 Montenegro
-
 Morocco
-
 Mozambique
-
 Myanmar
-
 Namibia
-
 Nepal
Nepal
-
 Netherlands
-
 New Zealand
-
 Nigeria
-
 North Macedonia
-
 Norway
-
 Oman
Oman
-
 Pakistan
-
 Palestine
-
 Panama
-
 Papua New Guinea
-
 Paraguay
-
 Peru
Peru
-
 Philippines
-
 Poland
-
 Portugal
-
 Puerto Rico
-
 Qatar
Qatar
-
 Reunion
-
 Romania
-
 Rwanda
-
 Saudi Arabia
-
 Serbia
-
 Singapore
-
 Slovakia
-
 Slovenia
-
 Somalia
-
 South Africa
-
 Spain
Spain
-
 Sri Lanka
-
 Sweden
-
 Switzerland
-
 Syria
Syria
-
 Taiwan
-
 Tajikistan
-
 Tanzania
-
 Thailand
-
 Trinidad and Tobago
-
 Tunisia
-
 Turkey
-
 UAE
UAE
-
 Uganda
-
 Ukraine
-
 United Kingdom
-
United States
-
 Uruguay
-
 Uzbekistan
-
 Venezuela
-
 Vietnam
-
 Yemen
Yemen
-
 Zambia
-
 Zimbabwe
- Forex
- Crypto
