
Sundial Growers stock edges higher as short-term bounce offsets longer-term weakness

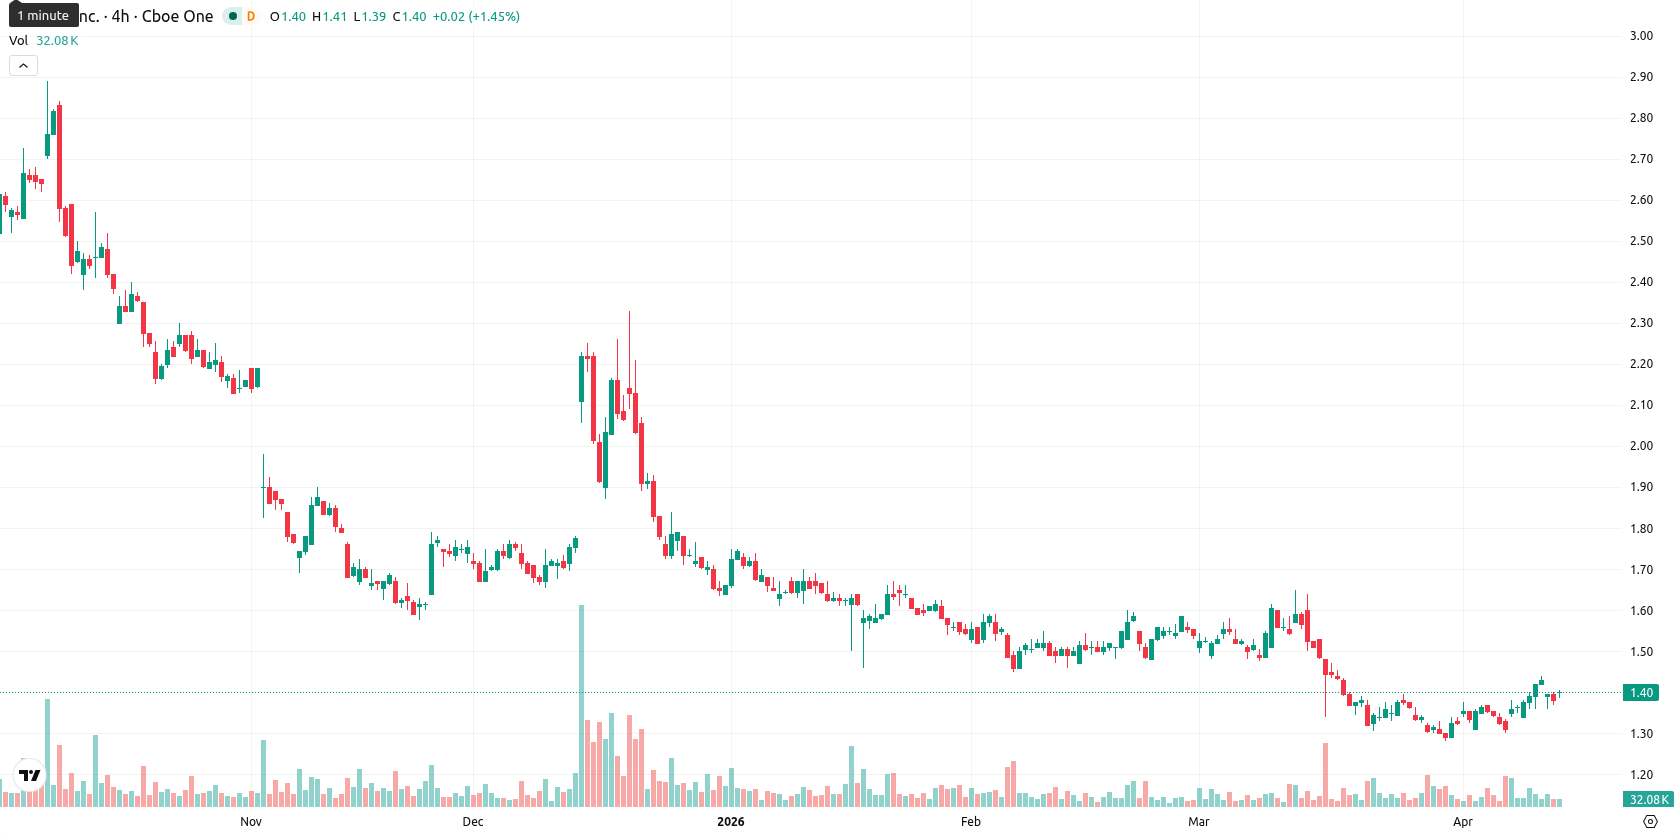
Sundial Growers Inc. (SNDL) is trading at $1.40, up 1.82% on the day. The price remains above the MA-20 ($1.36), but below both the MA-50 ($1.46) and MA-200 ($1.82), indicating a short-term bullish tone within a still bearish medium- and long-term structure.
Highlights
- SNDL's price action is short-term bullish above its 20-day trend but faces persistent medium- and long-term bearish pressure.
- Momentum signals are mixed, with indicators like MACD and ADX showing weak upside while oscillators signal possible overbought conditions.
- Expected to trade in a $1.28–$1.44 range over the next week, with less than 20% probability of a rise and near-term resistance at $1.47.
Intraday buy signals diverge from overarching bearish technicals
Technically, the immediate resistance is signaled by the Ichimoku Kijun at $1.47, while support is located at $1.28. Daily momentum is mixed: MACD offers a Strong Sell, ADX signals sustained selling pressure, RSI is near neutral at 46, and Stoch RSI is in sell territory, reflecting overbought conditions. CCI is neutral-positive, and BBP indicates Strong Buy, underscoring notable buyer control during intraday trading. SNDL opened with a gap up and is trading near the session's high between $1.39 and $1.41, with muted volatility and persistent price firmness after the open. However, the combination of a strong intraday BBP and broader bearish momentum across other indicators highlights a divergence between short-term buying strength and prevailing trend weakness.
Limited rally prospects as downside bias persists in short-term outlook
Over the next five trading days, SNDL is expected to fluctuate within a $1.28 – $1.44 volatility band relative to current levels. The probability of a sustained price increase remains under 20%, making further downside the more likely scenario. The base case is for the stock to oscillate sideways within this corridor. A breakout above $1.47 would mark a bullish technical reversal, whereas a close below $1.28 would reinforce the bearish trajectory, consistent with negative weekly signals from the RSI, MACD, and moving averages.
Earlier, analysts noted that Sundial Growers remained under bearish pressure, with downside risks exceeding the likelihood of a sustainable recovery. The latest mixed momentum readings and strong intraday buying suggest heightened short-term volatility, making the upcoming tests of $1.28 support and $1.47 resistance critical for determining the next directional move.


-
 Afghanistan
-
 Albania
-
 Algeria
-
 Angola
-
 Argentina
-
 Armenia
-
 Australia
-
 Austria
-
 Azerbaijan
-
 Bahamas
-
 Bahrain
-
 Bangladesh
-
 Belarus
-
 Belgium
-
 Bolivia
-
 Botswana
-
 Brazil
-
 Brunei
-
 Bulgaria
-
 Cambodia
-
 Cameroon
-
 Canada
-
 Chile
Chile
-
 China
China
-
 Colombia
-
 Congo
Congo
-
 Costa Rica
-
 Cote d'Ivoire
-
 Croatia
-
 Cuba
Cuba
-
 Cyprus
-
 Czechia
-
 DR Congo
-
 Denmark
-
 Dominican Republic
-
 Ecuador
-
 Egypt
Egypt
-
 El Salvador
-
 Estonia
-
 Eswatini
-
 Ethiopia
-
 Finland
-
 France
-
 Georgia
-
 Germany
-
 Ghana
Ghana
-
 Greece
-
 Haiti
Haiti
-
 Hong Kong
-
 Hungary
-
 India
India
-
 Indonesia
-
 Iran, Islamic republic
-
 Iraq
Iraq
-
 Ireland
-
 Israel
-
 Italy
Italy
-
 Jamaica
-
 Japan
Japan
-
 Jordan
-
 Kazakhstan
-
 Kenya
Kenya
-
 Korea
Korea
-
 Kuwait
-
 Kyrgyzstan
-
 Laos
Laos
-
 Latvia
-
 Lebanon
-
 Lesotho
-
 Libya
Libya
-
 Lithuania
-
 Luxembourg
-
 Madagascar
-
 Malaysia
-
 Malta
Malta
-
 Mauritius
-
 Mexico
-
 Moldova
-
 Mongolia
-
 Montenegro
-
 Morocco
-
 Mozambique
-
 Myanmar
-
 Namibia
-
 Nepal
Nepal
-
 Netherlands
-
 New Zealand
-
 Nigeria
-
 North Macedonia
-
 Norway
-
 Oman
Oman
-
 Pakistan
-
 Palestine
-
 Panama
-
 Papua New Guinea
-
 Paraguay
-
 Peru
Peru
-
 Philippines
-
 Poland
-
 Portugal
-
 Puerto Rico
-
 Qatar
Qatar
-
 Reunion
-
 Romania
-
 Rwanda
-
 Saudi Arabia
-
 Serbia
-
 Singapore
-
 Slovakia
-
 Slovenia
-
 Somalia
-
 South Africa
-
 Spain
Spain
-
 Sri Lanka
-
 Sweden
-
 Switzerland
-
 Syria
Syria
-
 Taiwan
-
 Tajikistan
-
 Tanzania
-
 Thailand
-
 Trinidad and Tobago
-
 Tunisia
-
 Turkey
-
 UAE
UAE
-
 Uganda
-
 Ukraine
-
 United Kingdom
-
United States
-
 Uruguay
-
 Uzbekistan
-
 Venezuela
-
 Vietnam
-
 Yemen
Yemen
-
 Zambia
-
 Zimbabwe
- Forex
- Crypto
