
Overbought signals prompt caution as Sundial Growers stock rises 3.82%

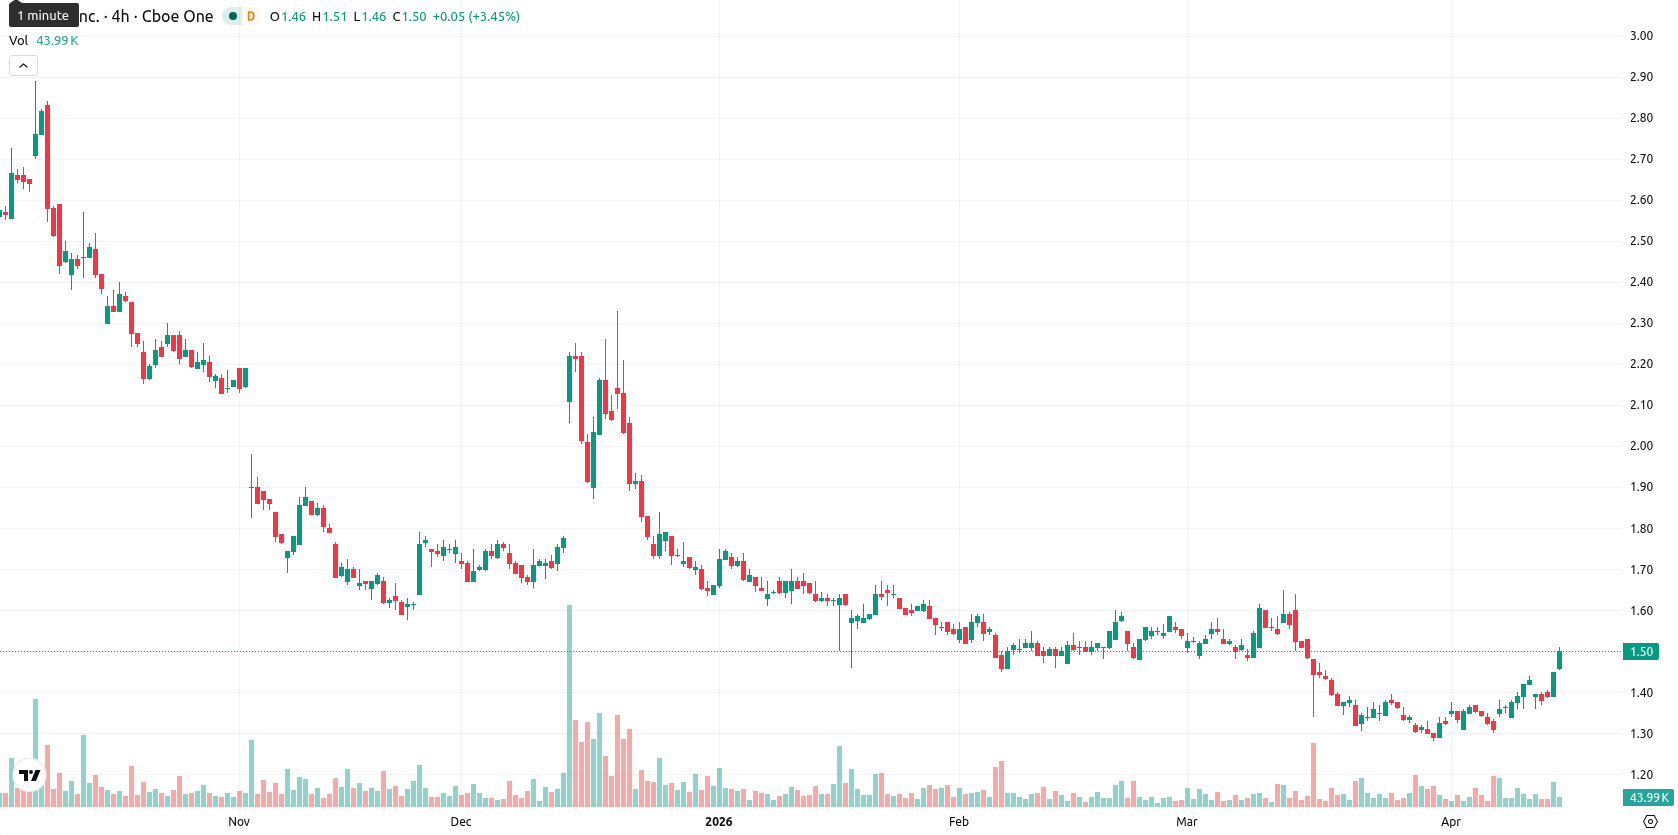
Sundial Growers Inc. (SNDL) is trading at $1.50 after gaining 3.82% today. The price sits above the MA-20 ($1.36) and MA-50 ($1.46) but remains below the MA-200 ($1.82), reflecting short- and medium-term strength, while longer-term resistance persists.
Highlights
- SNDL trades in a strengthening short- and medium-term uptrend, though long-term resistance limits upside momentum.
- Technical indicators signal mixed sentiment, with intraday buyer strength countered by overbought conditions and weak overall trend.
- Expect a sideways move in the $1.36–$1.54 range over five days, with low probability for further short-term gains.
Mixed momentum and overbought signals increase risk of near-term pullback
At $1.50, SNDL is trading above the MA-20 ($1.36) and MA-50 ($1.46) but remains well below the MA-200 ($1.82), signaling a strengthening short- and medium-term structure although long-term resistance persists. The Ichimoku Kijun at $1.47 acts as immediate support for the price. Momentum on the daily chart is mixed: MACD shows a strong sell, while ADX indicates weak trend presence. RSI is moderately bullish at 54.6, but both CCI (147.96) and Stoch RSI (100) signal overbought conditions, suggesting the current rally may be stretched. BBP is positive, indicating buyer dominance intraday. The price opened higher today without a significant gap from the previous close and is currently trading near the upper end of today’s range after a 3.8% advance, reflecting moderate intraday volatility and sustained buying strength toward session highs. However, the divergence between strong intraday buyer momentum and overbought oscillators points to a risk of near-term consolidation or pullback.
Sideways movement likely as technical signals remain unresolved
For the next five trading days, the expected price range for SNDL is $1.36 to $1.54, a volatility band relative to current levels. The base scenario suggests mostly sideways movement as mixed daily and weekly technical signals are unresolved. The probability of a further increase is very low (less than 20%), making a short-term pullback or stagnation more likely. A break above resistance could open the way to $1.54+, while a fall below immediate support risks a move toward $1.36; a cautious outlook is warranted until a clearer direction emerges.
Earlier, analysts noted that Sundial Growers remained under sustained bearish pressure with downside risks outweighing the potential for a lasting recovery. While the latest technical readings suggest buyers are attempting to assert control, traders should closely monitor the $1.47 support zone, as a decisive move in either direction could set the tone for the next phase.


-
 Afghanistan
-
 Albania
-
 Algeria
-
 Angola
-
 Argentina
-
 Armenia
-
 Australia
-
 Austria
-
 Azerbaijan
-
 Bahamas
-
 Bahrain
-
 Bangladesh
-
 Belarus
-
 Belgium
-
 Bolivia
-
 Botswana
-
 Brazil
-
 Brunei
-
 Bulgaria
-
 Cambodia
-
 Cameroon
-
 Canada
-
 Chile
Chile
-
 China
China
-
 Colombia
-
 Congo
Congo
-
 Costa Rica
-
 Cote d'Ivoire
-
 Croatia
-
 Cuba
Cuba
-
 Cyprus
-
 Czechia
-
 DR Congo
-
 Denmark
-
 Dominican Republic
-
 Ecuador
-
 Egypt
Egypt
-
 El Salvador
-
 Estonia
-
 Eswatini
-
 Ethiopia
-
 Finland
-
 France
-
 Georgia
-
 Germany
-
 Ghana
Ghana
-
 Greece
-
 Haiti
Haiti
-
 Hong Kong
-
 Hungary
-
 India
India
-
 Indonesia
-
 Iran, Islamic republic
-
 Iraq
Iraq
-
 Ireland
-
 Israel
-
 Italy
Italy
-
 Jamaica
-
 Japan
Japan
-
 Jordan
-
 Kazakhstan
-
 Kenya
Kenya
-
 Korea
Korea
-
 Kuwait
-
 Kyrgyzstan
-
 Laos
Laos
-
 Latvia
-
 Lebanon
-
 Lesotho
-
 Libya
Libya
-
 Lithuania
-
 Luxembourg
-
 Madagascar
-
 Malaysia
-
 Malta
Malta
-
 Mauritius
-
 Mexico
-
 Moldova
-
 Mongolia
-
 Montenegro
-
 Morocco
-
 Mozambique
-
 Myanmar
-
 Namibia
-
 Nepal
Nepal
-
 Netherlands
-
 New Zealand
-
 Nigeria
-
 North Macedonia
-
 Norway
-
 Oman
Oman
-
 Pakistan
-
 Palestine
-
 Panama
-
 Papua New Guinea
-
 Paraguay
-
 Peru
Peru
-
 Philippines
-
 Poland
-
 Portugal
-
 Puerto Rico
-
 Qatar
Qatar
-
 Reunion
-
 Romania
-
 Rwanda
-
 Saudi Arabia
-
 Serbia
-
 Singapore
-
 Slovakia
-
 Slovenia
-
 Somalia
-
 South Africa
-
 Spain
Spain
-
 Sri Lanka
-
 Sweden
-
 Switzerland
-
 Syria
Syria
-
 Taiwan
-
 Tajikistan
-
 Tanzania
-
 Thailand
-
 Trinidad and Tobago
-
 Tunisia
-
 Turkey
-
 UAE
UAE
-
 Uganda
-
 Ukraine
-
 United Kingdom
-
United States
-
 Uruguay
-
 Uzbekistan
-
 Venezuela
-
 Vietnam
-
 Yemen
Yemen
-
 Zambia
-
 Zimbabwe
- Forex
- Crypto
