
Tesla shares consolidate as oversold indicators persist on current volatility: weekly report

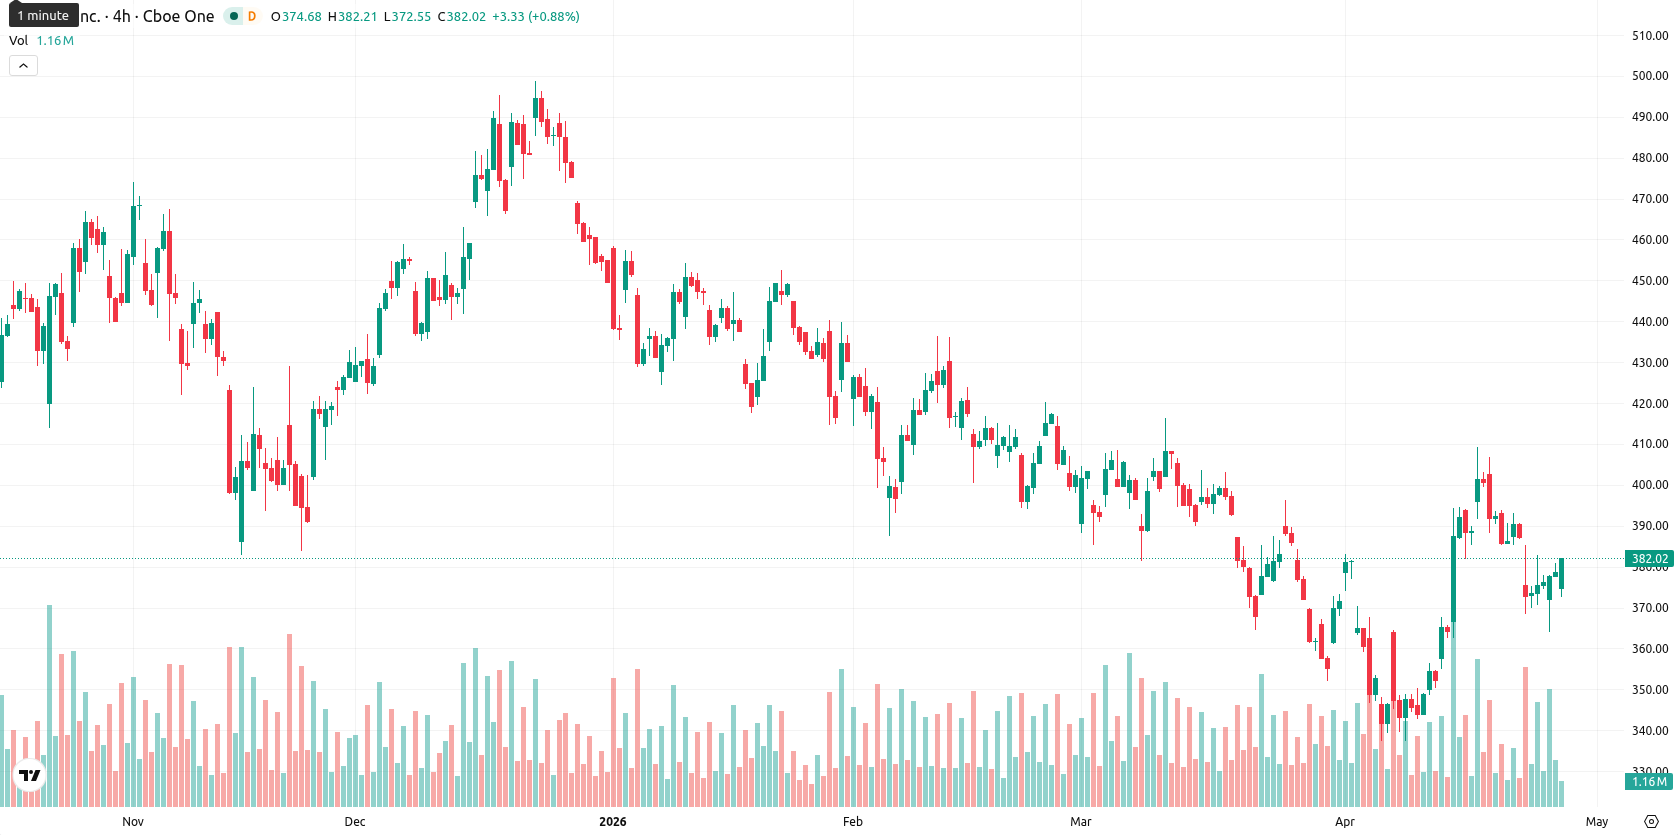
Tesla, Inc. (TSLA) is currently trading at $381.43, recording a weekly gain of $5.62, or 1.61%. The price remains below the weekly MA-20 ($409.05) and MA-50 ($387.94), yet it is positioned well above the MA-200 ($275.46), signaling continued medium-term selling pressure but maintaining a positive longer-term trend.
Highlights
- Tesla remains under medium-term selling pressure, trading beneath key moving averages but holding above its long-term trend support.
- Momentum indicators are weak with bearish signals dominating, reflecting mild oversold conditions and low trend strength.
- Expected seven-day price range is $364–$399, with a low probability of gains and a bias toward further downside movement.
Earnings beat shifts sentiment despite revenue drop and Musk share issuance
Tesla reported first-quarter 2026 results with revenue of approximately $22.39 billion and net income of $477 million, surpassing analyst profit expectations despite lower vehicle deliveries and marking its first annual group-level revenue decline. The company registered nearly 304 million shares related to Elon Musk’s 2018 CEO Performance Award, following a Delaware Supreme Court decision, while simultaneously announcing a $25 billion capital expenditure plan focused on AI, robotics, and hardware acquisition. Additional initiatives included increased FSD subscriptions to 1.3 million, release of FSD version 14.3.2 in North America, the launch of the Robotaxi app for Android, production start for Cybercab, and new customer incentives in response to softer Model 3 sales.
Ongoing seller control over the week as technical signals stay bearish
On the weekly chart, Tesla trades between its MA-50 and MA-200, highlighting ongoing medium-term weakness with longer-term support intact. The MACD is in Sell mode and the ADX signals a lack of strong directional momentum, while weekly RSI, Commodity Channel Index, and Bull/Bear Power all indicate that sellers are in control and the stock is mildly oversold. Weekly volatility remains elevated at 7.95% and the Stochastic RSI presents a neutral stance. Support is seen around $364, while resistance stands at $399.
Range-bound outlook for coming week amid persistent bearish momentum
Over the next five trading days, Tesla is likely to trade within the $364 – $399 range, mirroring its recent volatility and technical signals. With all four key indicators remaining bearish or neutral on the weekly timeframe, the probability of an upside break is very low, under 20%. The baseline scenario favors sideways movement; sustained seller pressure could push the price towards support at $364, while any improvement in momentum could lead to a retest of resistance at $399.
Earlier, analysts noted that Tesla was expected to remain rangebound due to mixed technical signals and increased risk from supply chain and security challenges. The latest developments—including resilient earnings amid revenue declines, major capital expenditures in AI and new mobility, and persistent medium-term selling pressure—reinforce a sideways outlook, making $364 and $399 key levels to watch for any potential breakout direction.


Latest Tesla News


-
 Afghanistan
-
 Albania
-
 Algeria
-
 Angola
-
 Argentina
-
 Armenia
-
 Australia
-
 Austria
-
 Azerbaijan
-
 Bahamas
-
 Bahrain
-
 Bangladesh
-
 Belarus
-
 Belgium
-
 Bolivia
-
 Botswana
-
 Brazil
-
 Brunei
-
 Bulgaria
-
 Cambodia
-
 Cameroon
-
 Canada
-
 Chile
Chile
-
 China
China
-
 Colombia
-
 Congo
Congo
-
 Costa Rica
-
 Cote d'Ivoire
-
 Croatia
-
 Cuba
Cuba
-
 Cyprus
-
 Czechia
-
 DR Congo
-
 Denmark
-
 Dominican Republic
-
 Ecuador
-
 Egypt
Egypt
-
 El Salvador
-
 Estonia
-
 Eswatini
-
 Ethiopia
-
 Finland
-
 France
-
 Georgia
-
 Germany
-
 Ghana
Ghana
-
 Greece
-
 Haiti
Haiti
-
 Hong Kong
-
 Hungary
-
 India
India
-
 Indonesia
-
 Iran, Islamic republic
-
 Iraq
Iraq
-
 Ireland
-
 Israel
-
 Italy
Italy
-
 Jamaica
-
 Japan
Japan
-
 Jordan
-
 Kazakhstan
-
 Kenya
Kenya
-
 Korea
Korea
-
 Kuwait
-
 Kyrgyzstan
-
 Laos
Laos
-
 Latvia
-
 Lebanon
-
 Lesotho
-
 Libya
Libya
-
 Lithuania
-
 Luxembourg
-
 Madagascar
-
 Malaysia
-
 Malta
Malta
-
 Mauritius
-
 Mexico
-
 Moldova
-
 Mongolia
-
 Montenegro
-
 Morocco
-
 Mozambique
-
 Myanmar
-
 Namibia
-
 Nepal
Nepal
-
 Netherlands
-
 New Zealand
-
 Nigeria
-
 North Macedonia
-
 Norway
-
 Oman
Oman
-
 Pakistan
-
 Palestine
-
 Panama
-
 Papua New Guinea
-
 Paraguay
-
 Peru
Peru
-
 Philippines
-
 Poland
-
 Portugal
-
 Puerto Rico
-
 Qatar
Qatar
-
 Reunion
-
 Romania
-
 Rwanda
-
 Saudi Arabia
-
 Serbia
-
 Singapore
-
 Slovakia
-
 Slovenia
-
 Somalia
-
 South Africa
-
 Spain
Spain
-
 Sri Lanka
-
 Sweden
-
 Switzerland
-
 Syria
Syria
-
 Taiwan
-
 Tajikistan
-
 Tanzania
-
 Thailand
-
 Trinidad and Tobago
-
 Tunisia
-
 Turkey
-
 UAE
UAE
-
 Uganda
-
 Ukraine
-
 United Kingdom
-
United States
-
 Uruguay
-
 Uzbekistan
-
 Venezuela
-
 Vietnam
-
 Yemen
Yemen
-
 Zambia
-
 Zimbabwe
- Forex
- Crypto
