
$398.00–$422.00 range keeps Microsoft stock trading flat

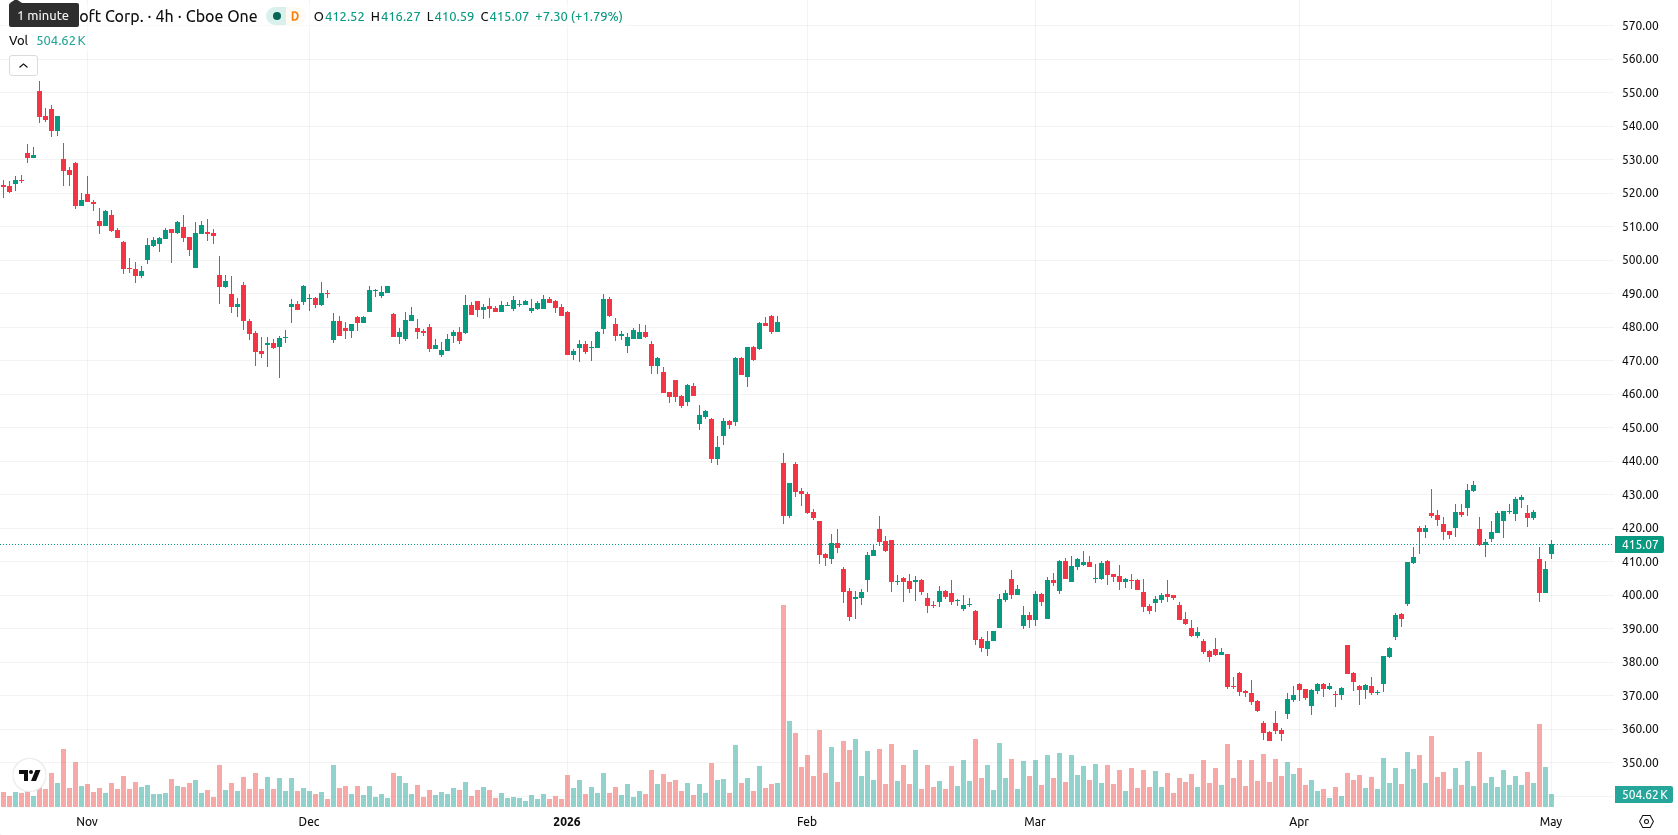
Microsoft Corporation (MSFT) is trading at $412.36, showing a daily gain of 0.38%. The price is positioned above its short-term moving averages, while remaining below its long-term average.
Highlights
- Microsoft is ramping up capital expenditures to expand datacenter and cloud capacity amid surging AI-driven demand and supply chain bottlenecks.
- While these investments position the company for long-term growth, they are raising structural costs and weighing on near-term margin expectations.
- Technically, MSFT trades near range highs with mixed momentum signals and is expected to move between $398.00 and $422.00 over the next week.
Rising capex reshapes investor sentiment amid AI-driven constraints
Microsoft is currently addressing significant physical infrastructure constraints as explosive artificial intelligence demand intersects with ongoing global supply chain challenges, pushing the company to increase its capital expenditure commitments. This elevated investment is aimed at expanding datacenter and cloud capabilities to sustain long-term growth, but it also increases the company's structural cost base and shapes expectations for future earnings. These operational dynamics are affecting how investors balance growth potential against near-term margin pressures.
Mixed momentum signals as technical support and resistance converge
On the daily chart, MSFT is trading above both the SMA-20 at $403.64 and the SMA-50 at $395.83, with immediate support provided by the Ichimoku Kijun at $394.99. However, the stock remains well below the SMA-200 at $468.46, and the $398.00 level serves as a crucial technical support, while $422.00 stands as the nearest resistance. Momentum indicators present mixed signals: the MACD and ADX reflect bullish momentum, but the RSI is neutral at 52.77, and the Bull/Bear Power (BBP) points to ongoing seller pressure and an oversold condition. The Stochastic RSI also shows oversold levels, suggesting the possibility of a short-term bounce, while the Commodity Channel Index (CCI) remains neutral and the Awesome Oscillator (AO) does not confirm the trend. After a volatile trading session with the price closing near the session high, the divergence between oscillator signals highlights near-term uncertainty.
Consolidation expected as upside probability remains limited
Over the next five trading days, MSFT is expected to fluctuate within a typical volatility band between $398.00 and $422.00. The probability of a price increase remains low, at less than 20%, favoring a consolidation scenario or a mild decline. The baseline projection envisions sideways movement with support near $398.00 and resistance just below $422.00. A decisive break above this resistance could result in additional upside, while a drop below $398.00 would expose the stock to further selling toward lower support levels.
In a recent review, analysts characterized Microsoft’s outlook as cautiously bearish, citing ongoing volatility amid strong earnings growth and heightened investment in AI and infrastructure. The current analysis adds nuance to this view by highlighting how persistent supply chain constraints and rising capital expenditures are shaping a period of near-term uncertainty, making a sustained directional breakout above resistance a crucial development to watch for renewed momentum.


Latest Microsoft News


-
 Afghanistan
-
 Albania
-
 Algeria
-
 Angola
-
 Argentina
-
 Armenia
-
 Australia
-
 Austria
-
 Azerbaijan
-
 Bahamas
-
 Bahrain
-
 Bangladesh
-
 Belarus
-
 Belgium
-
 Bolivia
-
 Botswana
-
 Brazil
-
 Brunei
-
 Bulgaria
-
 Cambodia
-
 Cameroon
-
 Canada
-
 Chile
Chile
-
 China
China
-
 Colombia
-
 Congo
Congo
-
 Costa Rica
-
 Cote d'Ivoire
-
 Croatia
-
 Cuba
Cuba
-
 Cyprus
-
 Czechia
-
 DR Congo
-
 Denmark
-
 Dominican Republic
-
 Ecuador
-
 Egypt
Egypt
-
 El Salvador
-
 Estonia
-
 Eswatini
-
 Ethiopia
-
 Finland
-
 France
-
 Georgia
-
 Germany
-
 Ghana
Ghana
-
 Greece
-
 Haiti
Haiti
-
 Hong Kong
-
 Hungary
-
 India
India
-
 Indonesia
-
 Iran, Islamic republic
-
 Iraq
Iraq
-
 Ireland
-
 Israel
-
 Italy
Italy
-
 Jamaica
-
 Japan
Japan
-
 Jordan
-
 Kazakhstan
-
 Kenya
Kenya
-
 Korea
Korea
-
 Kuwait
-
 Kyrgyzstan
-
 Laos
Laos
-
 Latvia
-
 Lebanon
-
 Lesotho
-
 Libya
Libya
-
 Lithuania
-
 Luxembourg
-
 Madagascar
-
 Malaysia
-
 Malta
Malta
-
 Mauritius
-
 Mexico
-
 Moldova
-
 Mongolia
-
 Montenegro
-
 Morocco
-
 Mozambique
-
 Myanmar
-
 Namibia
-
 Nepal
Nepal
-
 Netherlands
-
 New Zealand
-
 Nigeria
-
 North Macedonia
-
 Norway
-
 Oman
Oman
-
 Pakistan
-
 Palestine
-
 Panama
-
 Papua New Guinea
-
 Paraguay
-
 Peru
Peru
-
 Philippines
-
 Poland
-
 Portugal
-
 Puerto Rico
-
 Qatar
Qatar
-
 Reunion
-
 Romania
-
 Rwanda
-
 Saudi Arabia
-
 Serbia
-
 Singapore
-
 Slovakia
-
 Slovenia
-
 Somalia
-
 South Africa
-
 Spain
Spain
-
 Sri Lanka
-
 Sweden
-
 Switzerland
-
 Syria
Syria
-
 Taiwan
-
 Tajikistan
-
 Tanzania
-
 Thailand
-
 Trinidad and Tobago
-
 Tunisia
-
 Turkey
-
 UAE
UAE
-
 Uganda
-
 Ukraine
-
 United Kingdom
-
United States
-
 Uruguay
-
 Uzbekistan
-
 Venezuela
-
 Vietnam
-
 Yemen
Yemen
-
 Zambia
-
 Zimbabwe
- Forex
- Crypto
