
$400 support helps Microsoft stock maintain recent gains

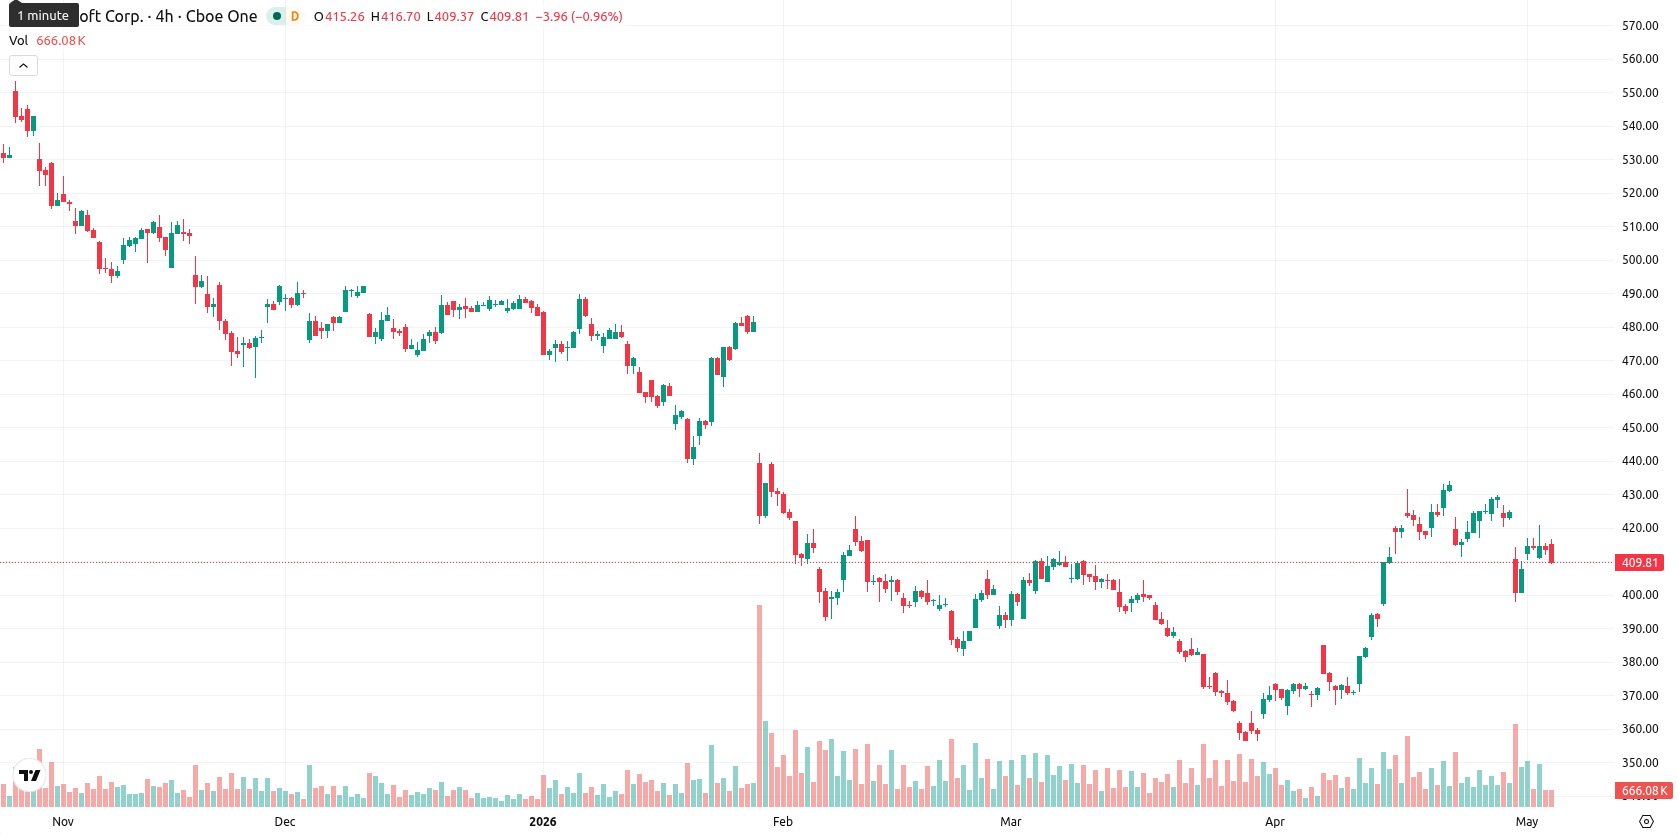
Microsoft Corporation (MSFT) is trading at $410.08, down 0.62% for the day. The price currently sits just above its short-term averages and reflects a moderate move, with position relative to its recent mean levels.
Highlights
- Microsoft delivered strong Q3 2026 results with $82.9 billion in revenue, up 18% year-over-year, and EPS growth of 21%.
- Cloud momentum remained robust led by Azure and Microsoft 365 Copilot enterprise adoption, though shares faced broader market selling pressure.
- Technicals point to consolidation between $400 and $420 as mixed momentum signals and long-term weakness increase risk of a corrective move.
Cloud growth and earnings beat offset by persistent selling pressure
Microsoft reported revenue of $82.9 billion for the fiscal third quarter of 2026, representing 18% year-over-year growth and surpassing consensus estimates. Diluted earnings per share rose to $4.27, up 21%, while operating income increased by 20%, reflecting improvements in profitability. Growth in Azure and the Intelligent Cloud division, notable adoption of Microsoft 365 Copilot by enterprise clients such as Accenture, and the restructuring of the OpenAI partnership were also disclosed, though price action has remained under broader selling pressure.
Mixed momentum as overbought signals clash with weak trend readings
MSFT trades just above the SMA-20 at $407.47 and well above the SMA-50 ($396.38), while remaining far below the SMA-200 ($467.49). The Ichimoku Kijun line on the D1 timeframe is currently at $394.99, acting as immediate support. MACD on the daily chart signals strong upward bias, but the ADX at 21.74 indicates the overall trend is weak but still classed as Buy. RSI stands at 53.55, supportive but not overbought, and Stoch RSI is oversold at 10.98. CCI is neutral, and the Awesome Oscillator is also neutral. BBP indicates an overbought condition, suggesting recent dominance by buyers, though price has now retreated close to session lows following an early upward gap. There is divergence between oversold oscillator readings and the overbought BBP, highlighting mixed momentum. Intraday volatility is moderate.
Consolidation favored as limited upside overshadows breakout potential
For the coming week, MSFT is expected to trade within a volatility band between $400 and $420, which is typical for a blue-chip stock at these levels. The probability of an increase above current levels is low (less than 20%), and a move lower remains more likely based on the lack of bullish signals from weekly momentum and trend indicators. The base scenario is consolidation around the current price corridor. A breakout above $420 could trigger renewed upward momentum, while a clear break below $400 would likely invite further selling and mark a bearish scenario.
Earlier, analysts noted that Microsoft was facing near-term downside risks amid bearish technical signals and ongoing consolidation despite strong fundamentals. With mixed momentum and volatility now concentrating near key moving averages, traders should closely monitor for a break outside the $400–$420 range, as either direction could set the tone for the next major move.


Latest Microsoft News


-
 Afghanistan
-
 Albania
-
 Algeria
-
 Angola
-
 Argentina
-
 Armenia
-
 Australia
-
 Austria
-
 Azerbaijan
-
 Bahamas
-
 Bahrain
-
 Bangladesh
-
 Belarus
-
 Belgium
-
 Bolivia
-
 Botswana
-
 Brazil
-
 Brunei
-
 Bulgaria
-
 Cambodia
-
 Cameroon
-
 Canada
-
 Chile
Chile
-
 China
China
-
 Colombia
-
 Congo
Congo
-
 Costa Rica
-
 Cote d'Ivoire
-
 Croatia
-
 Cuba
Cuba
-
 Cyprus
-
 Czechia
-
 DR Congo
-
 Denmark
-
 Dominican Republic
-
 Ecuador
-
 Egypt
Egypt
-
 El Salvador
-
 Estonia
-
 Eswatini
-
 Ethiopia
-
 Finland
-
 France
-
 Georgia
-
 Germany
-
 Ghana
Ghana
-
 Greece
-
 Haiti
Haiti
-
 Hong Kong
-
 Hungary
-
 India
India
-
 Indonesia
-
 Iran, Islamic republic
-
 Iraq
Iraq
-
 Ireland
-
 Israel
-
 Italy
Italy
-
 Jamaica
-
 Japan
Japan
-
 Jordan
-
 Kazakhstan
-
 Kenya
Kenya
-
 Korea
Korea
-
 Kuwait
-
 Kyrgyzstan
-
 Laos
Laos
-
 Latvia
-
 Lebanon
-
 Lesotho
-
 Libya
Libya
-
 Lithuania
-
 Luxembourg
-
 Madagascar
-
 Malaysia
-
 Malta
Malta
-
 Mauritius
-
 Mexico
-
 Moldova
-
 Mongolia
-
 Montenegro
-
 Morocco
-
 Mozambique
-
 Myanmar
-
 Namibia
-
 Nepal
Nepal
-
 Netherlands
-
 New Zealand
-
 Nigeria
-
 North Macedonia
-
 Norway
-
 Oman
Oman
-
 Pakistan
-
 Palestine
-
 Panama
-
 Papua New Guinea
-
 Paraguay
-
 Peru
Peru
-
 Philippines
-
 Poland
-
 Portugal
-
 Puerto Rico
-
 Qatar
Qatar
-
 Reunion
-
 Romania
-
 Rwanda
-
 Saudi Arabia
-
 Serbia
-
 Singapore
-
 Slovakia
-
 Slovenia
-
 Somalia
-
 South Africa
-
 Spain
Spain
-
 Sri Lanka
-
 Sweden
-
 Switzerland
-
 Syria
Syria
-
 Taiwan
-
 Tajikistan
-
 Tanzania
-
 Thailand
-
 Trinidad and Tobago
-
 Tunisia
-
 Turkey
-
 UAE
UAE
-
 Uganda
-
 Ukraine
-
 United Kingdom
-
United States
-
 Uruguay
-
 Uzbekistan
-
 Venezuela
-
 Vietnam
-
 Yemen
Yemen
-
 Zambia
-
 Zimbabwe
- Forex
- Crypto
