
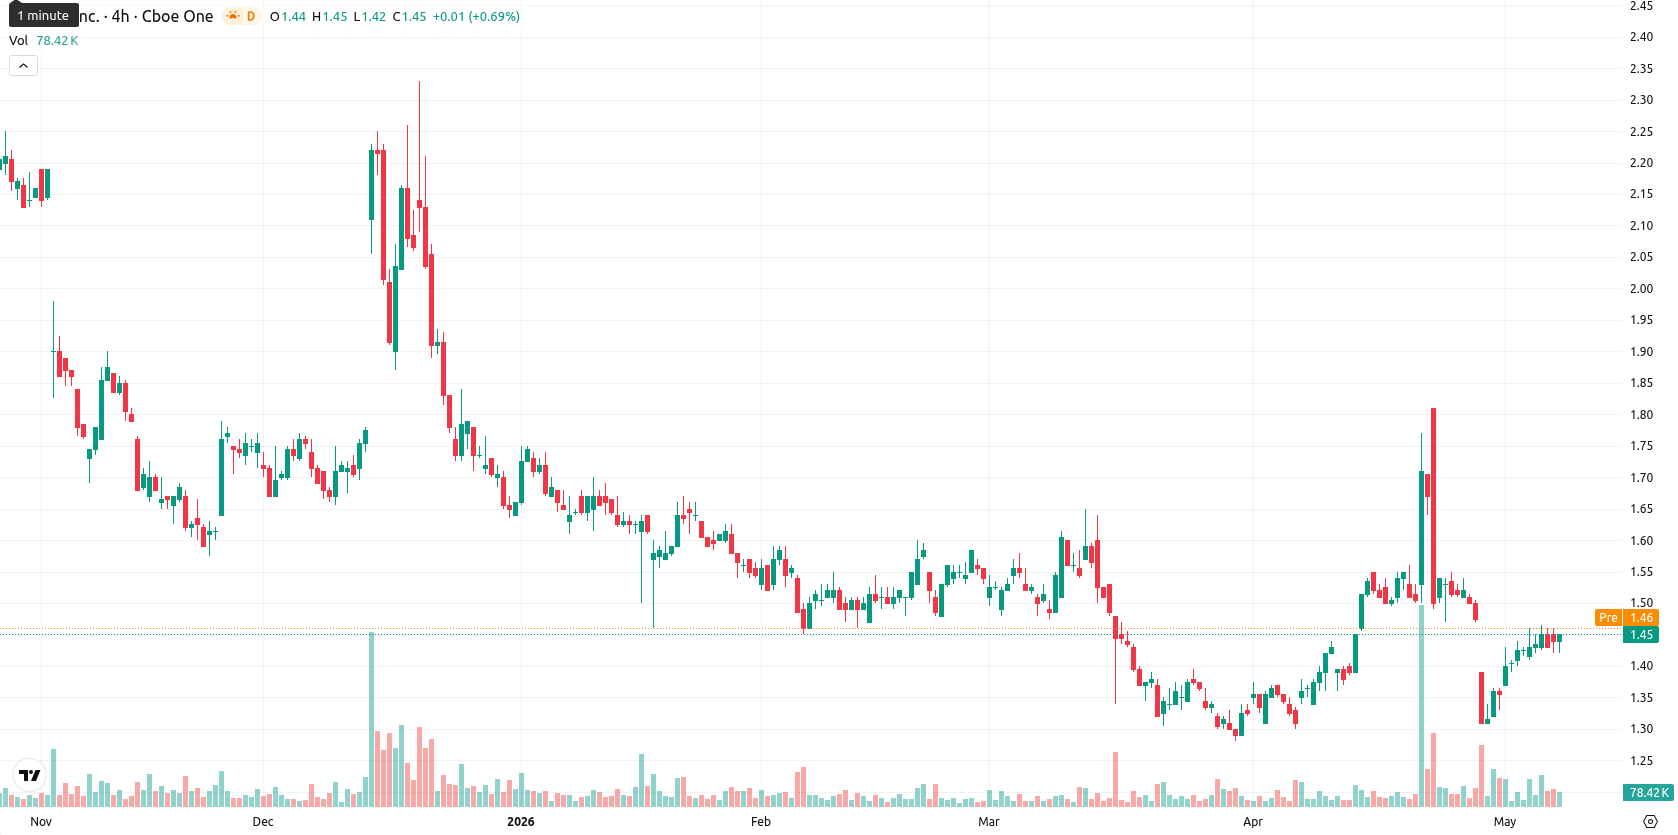
Flat trading for Sundial Growers stock as price stabilizes in $1.43–$1.50 range

Sundial Growers Inc. (SNDL) is trading at $1.44, marking no change for the day. The price sits below its key short-term averages, indicating ongoing pressure relative to recent trading levels.
Highlights
- SNDL remains under selling pressure, trading below key short- and long-term technical averages and facing persistent bearish sentiment.
- Momentum and oscillator signals are mixed and divergent, reflecting low conviction from both buyers and sellers amid muted intraday moves.
- SNDL is expected to trade sideways in the $1.43–$1.50 range next week, with a breakdown below $1.43 increasing downside risk.
Mixed momentum and narrow trading band reflect market indecision
SNDL is currently matched with the SMA-50 at $1.44, trades below the SMA-20 at $1.47, and remains well beneath the SMA-200 at $1.83. The Ichimoku Kijun level stands at $1.56, acting as immediate resistance. Momentum is mixed: the D1 MACD remains neutral, while the ADX leans modestly bullish, suggesting weak but emerging buyer interest. The RSI is neutral on the daily frame at 49.64 and signals selling on both daily and weekly intervals; Stoch RSI presents neutral conditions on D1 but is overbought in several intraday periods, and the CCI stays neutral. Bull/Bear Power is modestly positive at 0.01 with a buy signal, and the Awesome Oscillator signals strong intraday buying potential. SNDL is unchanged from the prior close, trading within a narrow $1.43–$1.46 band, reflecting low volatility and a session characterized by consolidation. Diverging readings among oscillators and indicators mirror the market's indecision.
Downside risk favored as volatility band narrows and resistance holds
In the short term, SNDL is likely to trade within a $1.43 to $1.50 volatility band relative to current levels, reflecting recent muted price action and typical intraday movements. The probability of a price increase remains low at less than 20%, while stagnation or further declines are favored. If bullish momentum does emerge, a decisive move above the $1.56 Kijun resistance could trigger upward extension; otherwise, a sustained drop below $1.43 would signal growing technical weakness and open the door to further downside if sellers intensify.
Earlier, analysts noted that Sundial Growers was exhibiting persistent technical weakness and lacked clear bullish momentum. The current analysis confirms this cautious outlook, with traders advised to monitor the $1.56 Kijun resistance as the critical level for any potential shift toward sustained upside.


-
 Afghanistan
-
 Albania
-
 Algeria
-
 Angola
-
 Argentina
-
 Armenia
-
 Australia
-
 Austria
-
 Azerbaijan
-
 Bahamas
-
 Bahrain
-
 Bangladesh
-
 Belarus
-
 Belgium
-
 Bolivia
-
 Botswana
-
 Brazil
-
 Brunei
-
 Bulgaria
-
 Cambodia
-
 Cameroon
-
 Canada
-
 Chile
Chile
-
 China
China
-
 Colombia
-
 Congo
Congo
-
 Costa Rica
-
 Cote d'Ivoire
-
 Croatia
-
 Cuba
Cuba
-
 Cyprus
-
 Czechia
-
 DR Congo
-
 Denmark
-
 Dominican Republic
-
 Ecuador
-
 Egypt
Egypt
-
 El Salvador
-
 Estonia
-
 Eswatini
-
 Ethiopia
-
 Finland
-
 France
-
 Georgia
-
 Germany
-
 Ghana
Ghana
-
 Greece
-
 Haiti
Haiti
-
 Hong Kong
-
 Hungary
-
 India
India
-
 Indonesia
-
 Iran, Islamic republic
-
 Iraq
Iraq
-
 Ireland
-
 Israel
-
 Italy
Italy
-
 Jamaica
-
 Japan
Japan
-
 Jordan
-
 Kazakhstan
-
 Kenya
Kenya
-
 Korea
Korea
-
 Kuwait
-
 Kyrgyzstan
-
 Laos
Laos
-
 Latvia
-
 Lebanon
-
 Lesotho
-
 Libya
Libya
-
 Lithuania
-
 Luxembourg
-
 Madagascar
-
 Malaysia
-
 Malta
Malta
-
 Mauritius
-
 Mexico
-
 Moldova
-
 Mongolia
-
 Montenegro
-
 Morocco
-
 Mozambique
-
 Myanmar
-
 Namibia
-
 Nepal
Nepal
-
 Netherlands
-
 New Zealand
-
 Nigeria
-
 North Macedonia
-
 Norway
-
 Oman
Oman
-
 Pakistan
-
 Palestine
-
 Panama
-
 Papua New Guinea
-
 Paraguay
-
 Peru
Peru
-
 Philippines
-
 Poland
-
 Portugal
-
 Puerto Rico
-
 Qatar
Qatar
-
 Reunion
-
 Romania
-
 Rwanda
-
 Saudi Arabia
-
 Serbia
-
 Singapore
-
 Slovakia
-
 Slovenia
-
 Somalia
-
 South Africa
-
 Spain
Spain
-
 Sri Lanka
-
 Sweden
-
 Switzerland
-
 Syria
Syria
-
 Taiwan
-
 Tajikistan
-
 Tanzania
-
 Thailand
-
 Trinidad and Tobago
-
 Tunisia
-
 Turkey
-
 UAE
UAE
-
 Uganda
-
 Ukraine
-
 United Kingdom
-
United States
-
 Uruguay
-
 Uzbekistan
-
 Venezuela
-
 Vietnam
-
 Yemen
Yemen
-
 Zambia
-
 Zimbabwe
- Forex
- Crypto
