
Tesla stock holds steady above key moving averages as MA-20 offers nearby support: weekly outlook

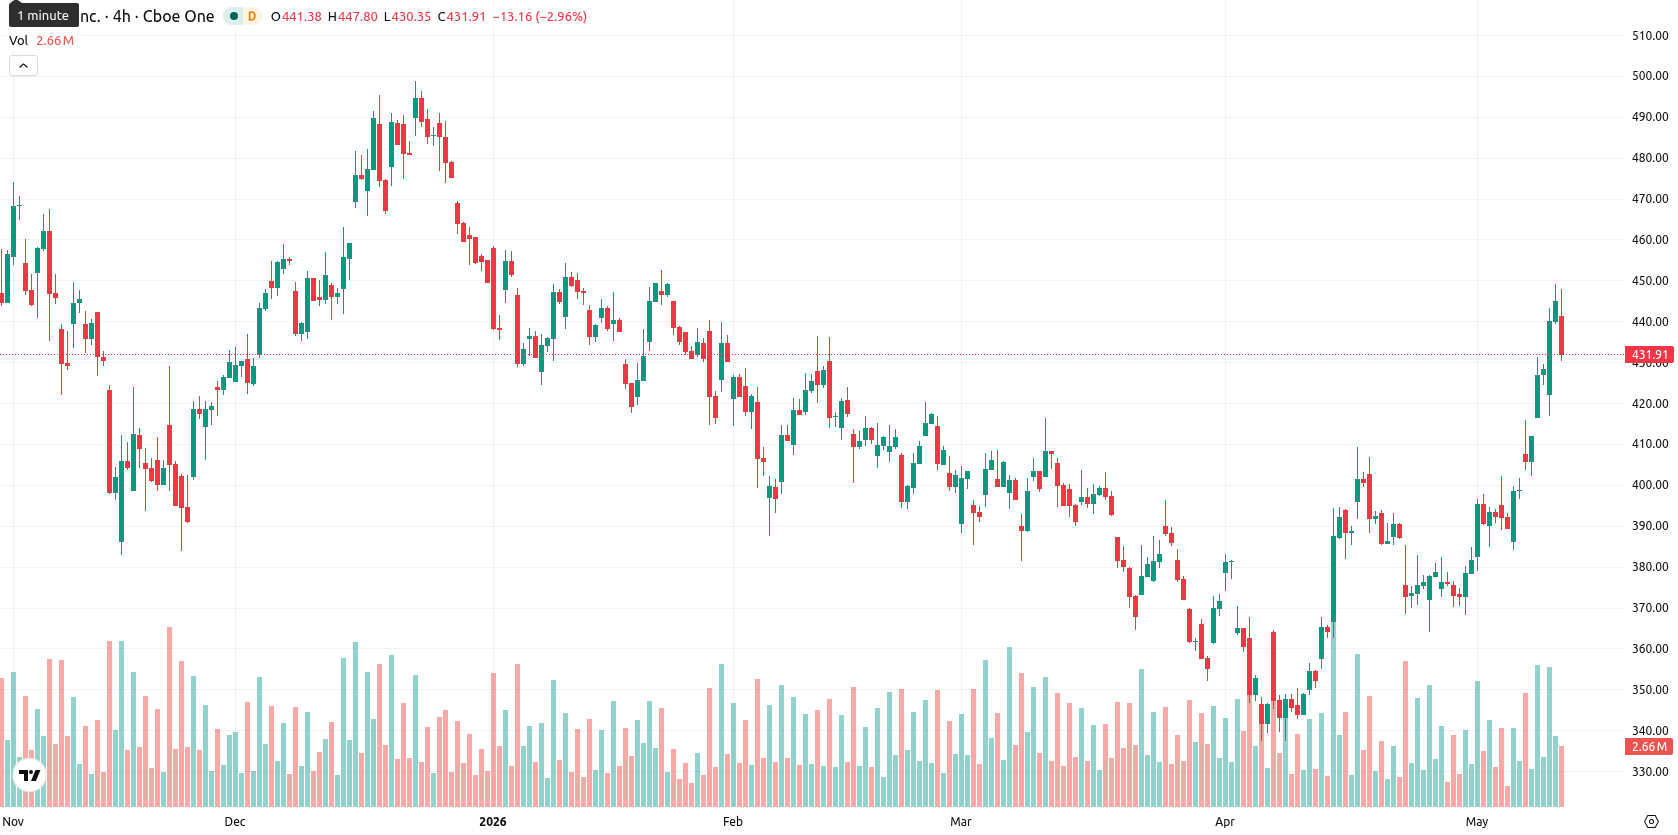
Tesla, Inc. (TSLA) is trading at $429.70, well above the weekly MA-20 ($405.57), MA-50 ($391.96), and MA-200 ($277.44), confirming a persistent bullish structure across medium- and long-term trends. Over the past week, Tesla gained $1.70 (0.40%), with the price holding in the upper part of the W1 range and volatility at 16.96%.
Highlights
- Tesla remains in a confirmed medium-to-long-term bullish trend, trading above key moving averages despite mixed momentum signals.
- Current overbought conditions, visible in several oscillators, coincide with continued buyer dominance and a period of consolidation near recent highs.
- Technicals project a $410–$450 trading range this week, with bullish and bearish probabilities balanced and a possible breakout triggering the next directional move.
Robotaxi rollout and mixed China sales drive sentiment this week
Tesla advanced its robotaxi rollout across the United States, drawing significant attention to its autonomous vehicle initiatives. The company reported a 36% year-over-year sales increase from its Shanghai factory in April 2026, while retail sales in China declined 10% to 25,956 vehicles in the same month. Additionally, Tesla recalled 173 Cybertrucks to address a wheel-hub issue and deployed software version 2026.8.200 in new Model 3 and Model Y vehicles, with the Model Y achieving a first-ever pass of the NHTSA’s new ADAS benchmark. Institutional investors, such as Swiss Life Asset Management Ltd and Meridian Wealth Management LLC, adjusted their Tesla holdings over the latest quarter.
Technicals mixed as overbought signals meet bullish momentum over the week
On the weekly chart, Tesla remains firmly above all key moving averages, with the MA-20 ($405.57) acting as the nearest dynamic support and the MA-50 ($391.96) and MA-200 ($277.44) confirming the longer-term uptrend. Weekly momentum indicators are mixed: MACD and ADX are neutral, while Stochastic RSI and Bull/Bear Power signal overbought conditions; RSI and the Commodity Channel Index point to ongoing buying momentum. Bull/Bear Power confirms buyer dominance. Price action is consolidating near highs, but diverging signals suggest uncertainty about direction.
Sideways bias persists as breakout risk defines weekly outlook
For the next 5 trading days, Tesla is expected to remain in a consolidation range between $410 and $450, reflecting current volatility and mixed momentum signals on the weekly chart. Momentum indicators split evenly between bullish and neutral, giving roughly equal probabilities to upward and downward movement in the coming week. The most likely scenario is continued sideways action unless a decisive breakout above $450 or a breakdown below $410 occurs, in which case a renewed trend could develop toward the next major resistance or support.
Earlier, analysts noted that Tesla was exhibiting strong technical structure but faced rising risks and a need for close monitoring of key support levels. With new data on institutional positioning and operational advancements now emerging, traders should monitor the evolving consolidation zone for a potential breakout above $450 or a breakdown below $410 as cues for the next directional move.


Latest Tesla News


-
 Afghanistan
-
 Albania
-
 Algeria
-
 Angola
-
 Argentina
-
 Armenia
-
 Australia
-
 Austria
-
 Azerbaijan
-
 Bahamas
-
 Bahrain
-
 Bangladesh
-
 Belarus
-
 Belgium
-
 Bolivia
-
 Botswana
-
 Brazil
-
 Brunei
-
 Bulgaria
-
 Cambodia
-
 Cameroon
-
 Canada
-
 Chile
Chile
-
 China
China
-
 Colombia
-
 Congo
Congo
-
 Costa Rica
-
 Cote d'Ivoire
-
 Croatia
-
 Cuba
Cuba
-
 Cyprus
-
 Czechia
-
 DR Congo
-
 Denmark
-
 Dominican Republic
-
 Ecuador
-
 Egypt
Egypt
-
 El Salvador
-
 Estonia
-
 Eswatini
-
 Ethiopia
-
 Finland
-
 France
-
 Georgia
-
 Germany
-
 Ghana
Ghana
-
 Greece
-
 Haiti
Haiti
-
 Hong Kong
-
 Hungary
-
 India
India
-
 Indonesia
-
 Iran, Islamic republic
-
 Iraq
Iraq
-
 Ireland
-
 Israel
-
 Italy
Italy
-
 Jamaica
-
 Japan
Japan
-
 Jordan
-
 Kazakhstan
-
 Kenya
Kenya
-
 Korea
Korea
-
 Kuwait
-
 Kyrgyzstan
-
 Laos
Laos
-
 Latvia
-
 Lebanon
-
 Lesotho
-
 Libya
Libya
-
 Lithuania
-
 Luxembourg
-
 Madagascar
-
 Malaysia
-
 Malta
Malta
-
 Mauritius
-
 Mexico
-
 Moldova
-
 Mongolia
-
 Montenegro
-
 Morocco
-
 Mozambique
-
 Myanmar
-
 Namibia
-
 Nepal
Nepal
-
 Netherlands
-
 New Zealand
-
 Nigeria
-
 North Macedonia
-
 Norway
-
 Oman
Oman
-
 Pakistan
-
 Palestine
-
 Panama
-
 Papua New Guinea
-
 Paraguay
-
 Peru
Peru
-
 Philippines
-
 Poland
-
 Portugal
-
 Puerto Rico
-
 Qatar
Qatar
-
 Reunion
-
 Romania
-
 Rwanda
-
 Saudi Arabia
-
 Serbia
-
 Singapore
-
 Slovakia
-
 Slovenia
-
 Somalia
-
 South Africa
-
 Spain
Spain
-
 Sri Lanka
-
 Sweden
-
 Switzerland
-
 Syria
Syria
-
 Taiwan
-
 Tajikistan
-
 Tanzania
-
 Thailand
-
 Trinidad and Tobago
-
 Tunisia
-
 Turkey
-
 UAE
UAE
-
 Uganda
-
 Ukraine
-
 United Kingdom
-
United States
-
 Uruguay
-
 Uzbekistan
-
 Venezuela
-
 Vietnam
-
 Yemen
Yemen
-
 Zambia
-
 Zimbabwe
- Forex
- Crypto
