
-3.69% for Tesla stock as China retail sales fall 10% year-over-year

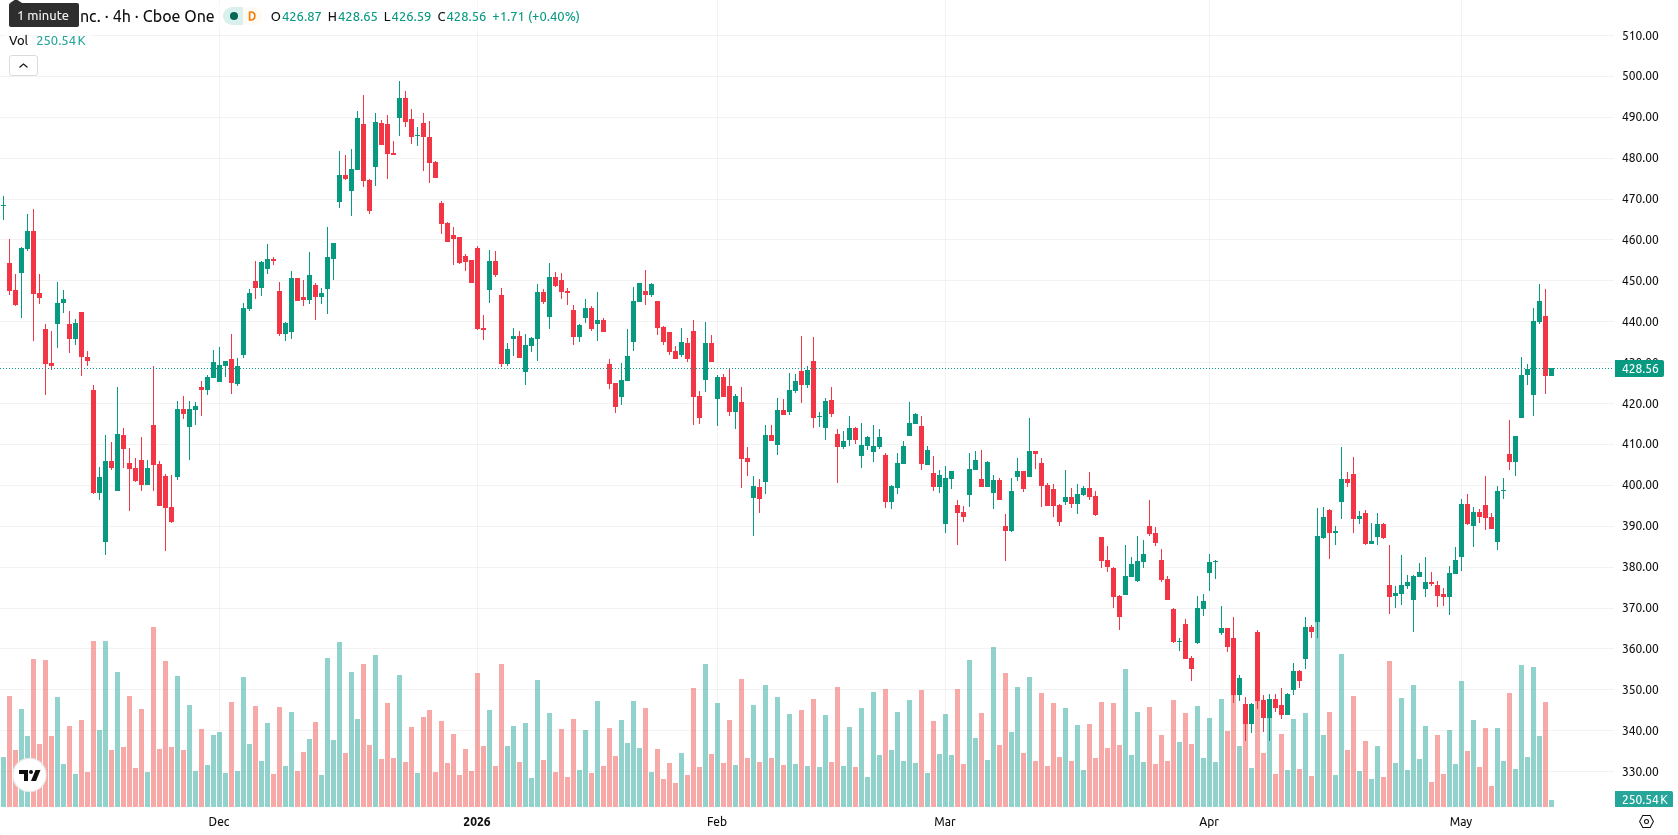
Tesla, Inc. (TSLA) is trading at $428.58, down 3.69% on the day. The stock remains elevated above its key moving averages, indicating continued strength relative to recent trading benchmarks.
Highlights
- Tesla is reducing reliance on China-made parts for U.S. vehicles due to rising tariffs and heightened trade barriers, increasing operational complexity and costs.
- Tesla faces international pressure from delayed Full Self-Driving approval and a 10% year-over-year decline in April 2026 retail sales in China.
- While the share price remains in a bullish technical pattern, overbought signals and a sharp post-open drop suggest elevated volatility with an expected short-term range of $415 to $465.
Supply chain complexity rises as tariffs drive sourcing shift
Tesla has accelerated its shift away from China-made components for vehicles produced for the U.S. market, prompted by the imposition of higher tariffs and stricter trade barriers between the countries. This adjustment introduces increased operational complexity and cost volatility for the company as it seeks to secure alternative supply channels. Elon Musk's involvement in President Trump's trade delegation to China on May 12 added direct engagement in ongoing tariff negotiations, while delays in Full Self-Driving (FSD) approval and a 10% year-over-year drop in April 2026 retail sales in China reflect additional regulatory and competitive headwinds facing Tesla abroad.
Upside capped as overbought signals meet resistance zone
Technically, TSLA has key support at the Ichimoku Kijun of $393.19 and sits well above the MA-20 ($391.36), MA-50 ($384.03), and MA-200 ($405.08). Resistance is found near the recent high area of $447–$450, while immediate downside risk emerges if the $422–$415 zone is breached. The MACD remains in buy mode, but upside momentum is challenged by overbought readings in RSI (74.1), Stoch RSI (100), and CCI (245.7), with the ADX signaling a weak trend and Awesome Oscillator still positive. Increased volatility is highlighted by the presence of high intraday selling pressure and mixed momentum signals.
Consolidation expected as upside potential faces overbought risks
In the short term, TSLA is expected to trade within a typical volatility band of $415 to $465 over the next five days. There is a strong probability of the price moving higher based on prevailing weekly trends, though overbought conditions raise near-term risk of pullbacks. The base case sees consolidation between immediate support and recent highs. A bullish scenario would require a breakout above $447–$450, whereas a decline below $422–$415 would suggest renewed short-term selling and a move toward the Kijun and MA-20 support levels.
Earlier, analysts noted that Tesla maintained a strong technical structure despite mixed signals, with traders watching for signs of consolidation or a potential breakout. The current landscape adds tariff-driven supply chain disruptions and heightened volatility to the equation, making the $415 support zone a crucial level for traders monitoring for renewed short-term downside risk.


Latest Tesla News


-
 Afghanistan
-
 Albania
-
 Algeria
-
 Angola
-
 Argentina
-
 Armenia
-
 Australia
-
 Austria
-
 Azerbaijan
-
 Bahamas
-
 Bahrain
-
 Bangladesh
-
 Belarus
-
 Belgium
-
 Bolivia
-
 Botswana
-
 Brazil
-
 Brunei
-
 Bulgaria
-
 Cambodia
-
 Cameroon
-
 Canada
-
 Chile
Chile
-
 China
China
-
 Colombia
-
 Congo
Congo
-
 Costa Rica
-
 Cote d'Ivoire
-
 Croatia
-
 Cuba
Cuba
-
 Cyprus
-
 Czechia
-
 DR Congo
-
 Denmark
-
 Dominican Republic
-
 Ecuador
-
 Egypt
Egypt
-
 El Salvador
-
 Estonia
-
 Eswatini
-
 Ethiopia
-
 Finland
-
 France
-
 Georgia
-
 Germany
-
 Ghana
Ghana
-
 Greece
-
 Haiti
Haiti
-
 Hong Kong
-
 Hungary
-
 India
India
-
 Indonesia
-
 Iran, Islamic republic
-
 Iraq
Iraq
-
 Ireland
-
 Israel
-
 Italy
Italy
-
 Jamaica
-
 Japan
Japan
-
 Jordan
-
 Kazakhstan
-
 Kenya
Kenya
-
 Korea
Korea
-
 Kuwait
-
 Kyrgyzstan
-
 Laos
Laos
-
 Latvia
-
 Lebanon
-
 Lesotho
-
 Libya
Libya
-
 Lithuania
-
 Luxembourg
-
 Madagascar
-
 Malaysia
-
 Malta
Malta
-
 Mauritius
-
 Mexico
-
 Moldova
-
 Mongolia
-
 Montenegro
-
 Morocco
-
 Mozambique
-
 Myanmar
-
 Namibia
-
 Nepal
Nepal
-
 Netherlands
-
 New Zealand
-
 Nigeria
-
 North Macedonia
-
 Norway
-
 Oman
Oman
-
 Pakistan
-
 Palestine
-
 Panama
-
 Papua New Guinea
-
 Paraguay
-
 Peru
Peru
-
 Philippines
-
 Poland
-
 Portugal
-
 Puerto Rico
-
 Qatar
Qatar
-
 Reunion
-
 Romania
-
 Rwanda
-
 Saudi Arabia
-
 Serbia
-
 Singapore
-
 Slovakia
-
 Slovenia
-
 Somalia
-
 South Africa
-
 Spain
Spain
-
 Sri Lanka
-
 Sweden
-
 Switzerland
-
 Syria
Syria
-
 Taiwan
-
 Tajikistan
-
 Tanzania
-
 Thailand
-
 Trinidad and Tobago
-
 Tunisia
-
 Turkey
-
 UAE
UAE
-
 Uganda
-
 Ukraine
-
 United Kingdom
-
United States
-
 Uruguay
-
 Uzbekistan
-
 Venezuela
-
 Vietnam
-
 Yemen
Yemen
-
 Zambia
-
 Zimbabwe
- Forex
- Crypto
