
Meta stock edges lower as Q1 2026 higher AI capital expenditure weighs

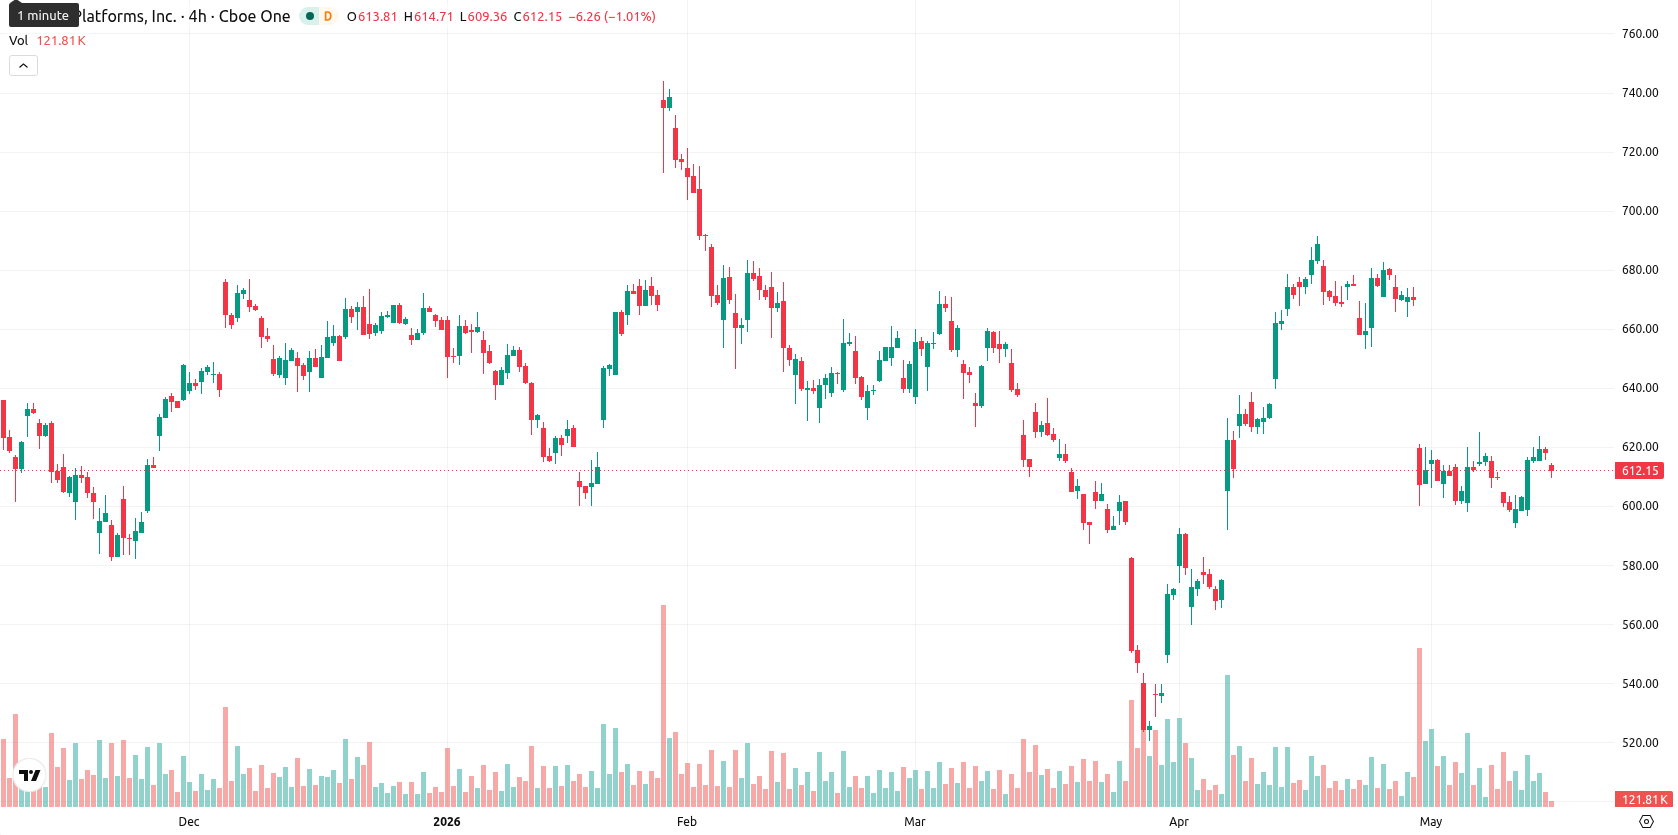
Meta Platforms, Inc. (META, formerly Facebook, Inc.) is trading at $610.20, recording a daily decline of 1.08%. The asset is below its key moving averages, indicating ongoing pressure from sellers.
Highlights
- Meta delivered strong Q1 2026 results with $56.3 billion in revenue and 61% net income growth, but guided sharply higher AI-related capex of $125–$145 billion.
- Market sentiment is cautious due to elevated investment costs, insider selling by COO Olivan, and ongoing pressure in Meta's advertising segment.
- META trades below major technical resistance, with sellers dominating and prices expected to range between $595 and $625 amid weak momentum.
Profit growth offset by capex concerns and insider selling
Meta reported first-quarter 2026 earnings on May 15, 2026, posting revenue of $56.3 billion and net income growth of 61%, reflecting strong financial performance for the period. However, increased guidance for artificial intelligence-related capital expenditures to a range of $125–$145 billion drew market focus, elevating concerns about rising investment costs and pressure on near-term profitability. Additionally, a recent insider sale by Chief Operating Officer Javier Olivan, who sold 1,555 shares valued at $940,106 on May 11, 2026, was disclosed. Developments in Meta's advertising business and improvements in ad performance metrics were also reported, though price action has remained under broader selling pressure.
Resistance zones and mixed momentum curb directional conviction
SMA-20 is positioned at $638.34, SMA-50 at $622.76, and SMA-200 at $673.83, all above the current price. The Ichimoku Kijun level sits at $642.03, marking immediate resistance. Momentum signals are mixed, with MACD and ADX reflecting weak bearish pressure, and the Awesome Oscillator remaining negative. RSI registers at 46.45, showing mildly bearish momentum, while Stoch RSI and CCI indicate a neutral-to-oversold environment. BBP confirms ongoing seller dominance intraday, and divergent oscillators highlight a lack of strong directional conviction despite sustained downward momentum.
Downside bias remains as range holds under weak momentum
For the next five trading days, the expected range for META is $595 to $625, marking a typical volatility band for the asset. The likelihood of a price increase is low (under 20%), and further downside is likely. Baseline expectations call for continued sideways movement between $595 and $625. A move above $642 would be required to shift sentiment to the upside, while a drop below $595 could risk an extended decline, given prevailing weak momentum and dominance of sell signals.
In a recent review, analysts highlighted Meta's strong profitability alongside persistent technical weakness and hesitant sentiment despite robust earnings and ongoing investment in AI initiatives. The latest developments reinforce this cautious outlook, with seller dominance and mixed momentum signals underscoring the importance of closely monitoring the $642 resistance as a potential pivot point for any shift in trend.


-
 Afghanistan
-
 Albania
-
 Algeria
-
 Angola
-
 Argentina
-
 Armenia
-
 Australia
-
 Austria
-
 Azerbaijan
-
 Bahamas
-
 Bahrain
-
 Bangladesh
-
 Belarus
-
 Belgium
-
 Bolivia
-
 Botswana
-
 Brazil
-
 Brunei
-
 Bulgaria
-
 Cambodia
-
 Cameroon
-
 Canada
-
 Chile
Chile
-
 China
China
-
 Colombia
-
 Congo
Congo
-
 Costa Rica
-
 Cote d'Ivoire
-
 Croatia
-
 Cuba
Cuba
-
 Cyprus
-
 Czechia
-
 DR Congo
-
 Denmark
-
 Dominican Republic
-
 Ecuador
-
 Egypt
Egypt
-
 El Salvador
-
 Estonia
-
 Eswatini
-
 Ethiopia
-
 Finland
-
 France
-
 Georgia
-
 Germany
-
 Ghana
Ghana
-
 Greece
-
 Haiti
Haiti
-
 Hong Kong
-
 Hungary
-
 India
India
-
 Indonesia
-
 Iran, Islamic republic
-
 Iraq
Iraq
-
 Ireland
-
 Israel
-
 Italy
Italy
-
 Jamaica
-
 Japan
Japan
-
 Jordan
-
 Kazakhstan
-
 Kenya
Kenya
-
 Korea
Korea
-
 Kuwait
-
 Kyrgyzstan
-
 Laos
Laos
-
 Latvia
-
 Lebanon
-
 Lesotho
-
 Libya
Libya
-
 Lithuania
-
 Luxembourg
-
 Madagascar
-
 Malaysia
-
 Malta
Malta
-
 Mauritius
-
 Mexico
-
 Moldova
-
 Mongolia
-
 Montenegro
-
 Morocco
-
 Mozambique
-
 Myanmar
-
 Namibia
-
 Nepal
Nepal
-
 Netherlands
-
 New Zealand
-
 Nigeria
-
 North Macedonia
-
 Norway
-
 Oman
Oman
-
 Pakistan
-
 Palestine
-
 Panama
-
 Papua New Guinea
-
 Paraguay
-
 Peru
Peru
-
 Philippines
-
 Poland
-
 Portugal
-
 Puerto Rico
-
 Qatar
Qatar
-
 Reunion
-
 Romania
-
 Rwanda
-
 Saudi Arabia
-
 Serbia
-
 Singapore
-
 Slovakia
-
 Slovenia
-
 Somalia
-
 South Africa
-
 Spain
Spain
-
 Sri Lanka
-
 Sweden
-
 Switzerland
-
 Syria
Syria
-
 Taiwan
-
 Tajikistan
-
 Tanzania
-
 Thailand
-
 Trinidad and Tobago
-
 Tunisia
-
 Turkey
-
 UAE
UAE
-
 Uganda
-
 Ukraine
-
 United Kingdom
-
United States
-
 Uruguay
-
 Uzbekistan
-
 Venezuela
-
 Vietnam
-
 Yemen
Yemen
-
 Zambia
-
 Zimbabwe
- Forex
- Crypto
