
PEP shares edge higher with MACD flashing strong buy signal: weekly forecast

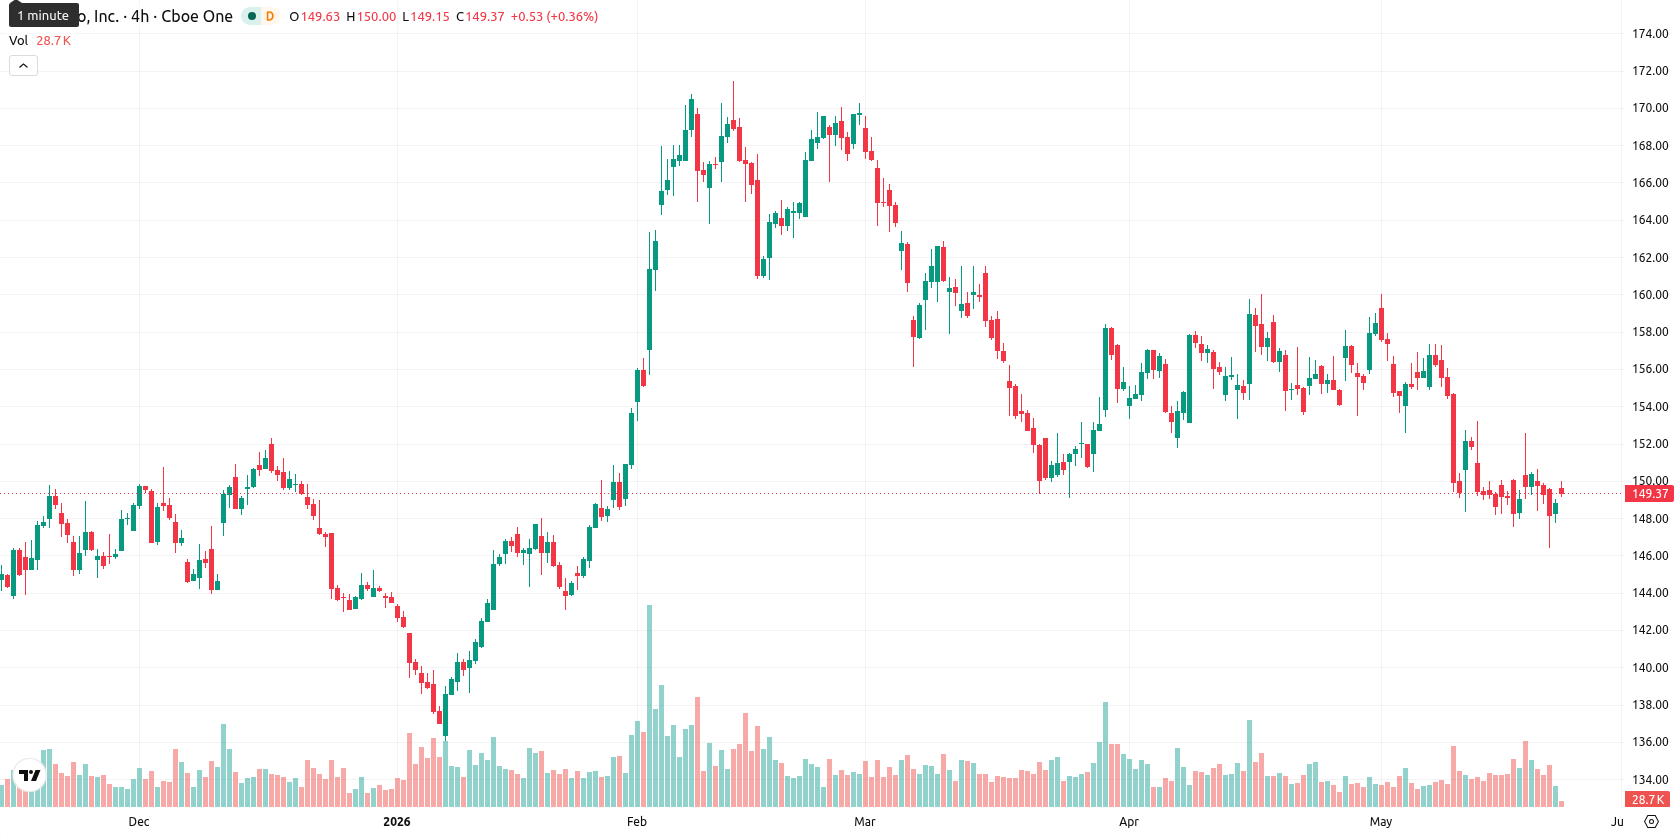
PepsiCo, Inc. (PEP) is trading at $149.59, slightly above its weekly MA-50 ($148.51) but below both the MA-20 ($155.76) and MA-200 ($163.82). Over the last week, the price moved up by $0.48, or 0.32%, reflecting mild upward movement and continued consolidation within the middle of the weekly range.
Highlights
- PepsiCo trades below major moving averages, indicating persistent medium- and long-term selling pressure.
- Technical indicators show mixed signals, with oscillators in oversold territory but trend strength lacking conviction.
- Price expected to consolidate between $146.18 and $153.00 next week, with a higher probability of downside movement.
Sustained growth and innovation support sentiment after earnings release
PepsiCo reported its first-quarter 2026 results on April 24, 2026, highlighting sustained momentum in its snack portfolio and selective price increases on smaller bags of chips to manage market pressures and boost organic growth. The company also launched PopCorners Protein within its convenience foods portfolio and posted nearly $94 billion in net revenue for 2025. Additionally, PepsiCo extended its exclusive bottling partnership with Varun Beverages in India to 2049 while Rathbones Group PLC reduced its holdings but remains a significant shareholder.
Consolidation above MA-50 as oversold signals and weak trend persist
Weekly technical analysis shows the price consolidating above the MA-50 but under the MA-20 and MA-200, signaling persistent selling pressure over the medium and long term. The weekly RSI stands at 45.53, indicating slightly oversold conditions, along with Stochastic RSI also in oversold territory. MACD provides a Strong Buy signal; however, the ADX remains neutral, suggesting weak trend strength. Weekly support is seen near $146.18, while resistance is set at $153.00, with volatility at 4.23%.
Range-bound bias for next week amid mixed technical signals
For the next 5 trading days, PepsiCo is expected to trade between $146.18 and $153.00. Consolidation within this range is the baseline scenario, as only one out of four key indicators signals a buy or strong buy outlook. A breakout above $153.00 could open the way for a bullish move, while a sustained drop below $146.18 would likely result in additional selling pressure.
Earlier, analysts noted that PepsiCo was exhibiting a neutral, range-bound bias as technical and fundamental signals were mixed and consolidation persisted. The latest data reinforce this cautious outlook, with traders advised to monitor for a potential breakout above $153.00 or breakdown below $146.18 that could trigger a shift in directional momentum.


-
 Afghanistan
-
 Albania
-
 Algeria
-
 Angola
-
 Argentina
-
 Armenia
-
 Australia
-
 Austria
-
 Azerbaijan
-
 Bahamas
-
 Bahrain
-
 Bangladesh
-
 Belarus
-
 Belgium
-
 Bolivia
-
 Botswana
-
 Brazil
-
 Brunei
-
 Bulgaria
-
 Cambodia
-
 Cameroon
-
 Canada
-
 Chile
Chile
-
 China
China
-
 Colombia
-
 Congo
Congo
-
 Costa Rica
-
 Cote d'Ivoire
-
 Croatia
-
 Cuba
Cuba
-
 Cyprus
-
 Czechia
-
 DR Congo
-
 Denmark
-
 Dominican Republic
-
 Ecuador
-
 Egypt
Egypt
-
 El Salvador
-
 Estonia
-
 Eswatini
-
 Ethiopia
-
 Finland
-
 France
-
 Georgia
-
 Germany
-
 Ghana
Ghana
-
 Greece
-
 Haiti
Haiti
-
 Hong Kong
-
 Hungary
-
 India
India
-
 Indonesia
-
 Iran, Islamic republic
-
 Iraq
Iraq
-
 Ireland
-
 Israel
-
 Italy
Italy
-
 Jamaica
-
 Japan
Japan
-
 Jordan
-
 Kazakhstan
-
 Kenya
Kenya
-
 Korea
Korea
-
 Kuwait
-
 Kyrgyzstan
-
 Laos
Laos
-
 Latvia
-
 Lebanon
-
 Lesotho
-
 Libya
Libya
-
 Lithuania
-
 Luxembourg
-
 Madagascar
-
 Malaysia
-
 Malta
Malta
-
 Mauritius
-
 Mexico
-
 Moldova
-
 Mongolia
-
 Montenegro
-
 Morocco
-
 Mozambique
-
 Myanmar
-
 Namibia
-
 Nepal
Nepal
-
 Netherlands
-
 New Zealand
-
 Nigeria
-
 North Macedonia
-
 Norway
-
 Oman
Oman
-
 Pakistan
-
 Palestine
-
 Panama
-
 Papua New Guinea
-
 Paraguay
-
 Peru
Peru
-
 Philippines
-
 Poland
-
 Portugal
-
 Puerto Rico
-
 Qatar
Qatar
-
 Reunion
-
 Romania
-
 Rwanda
-
 Saudi Arabia
-
 Serbia
-
 Singapore
-
 Slovakia
-
 Slovenia
-
 Somalia
-
 South Africa
-
 Spain
Spain
-
 Sri Lanka
-
 Sweden
-
 Switzerland
-
 Syria
Syria
-
 Taiwan
-
 Tajikistan
-
 Tanzania
-
 Thailand
-
 Trinidad and Tobago
-
 Tunisia
-
 Turkey
-
 UAE
UAE
-
 Uganda
-
 Ukraine
-
 United Kingdom
-
United States
-
 Uruguay
-
 Uzbekistan
-
 Venezuela
-
 Vietnam
-
 Yemen
Yemen
-
 Zambia
-
 Zimbabwe
- Forex
- Crypto
