
AMD stock price forecast: $505 support as AMD trades flat

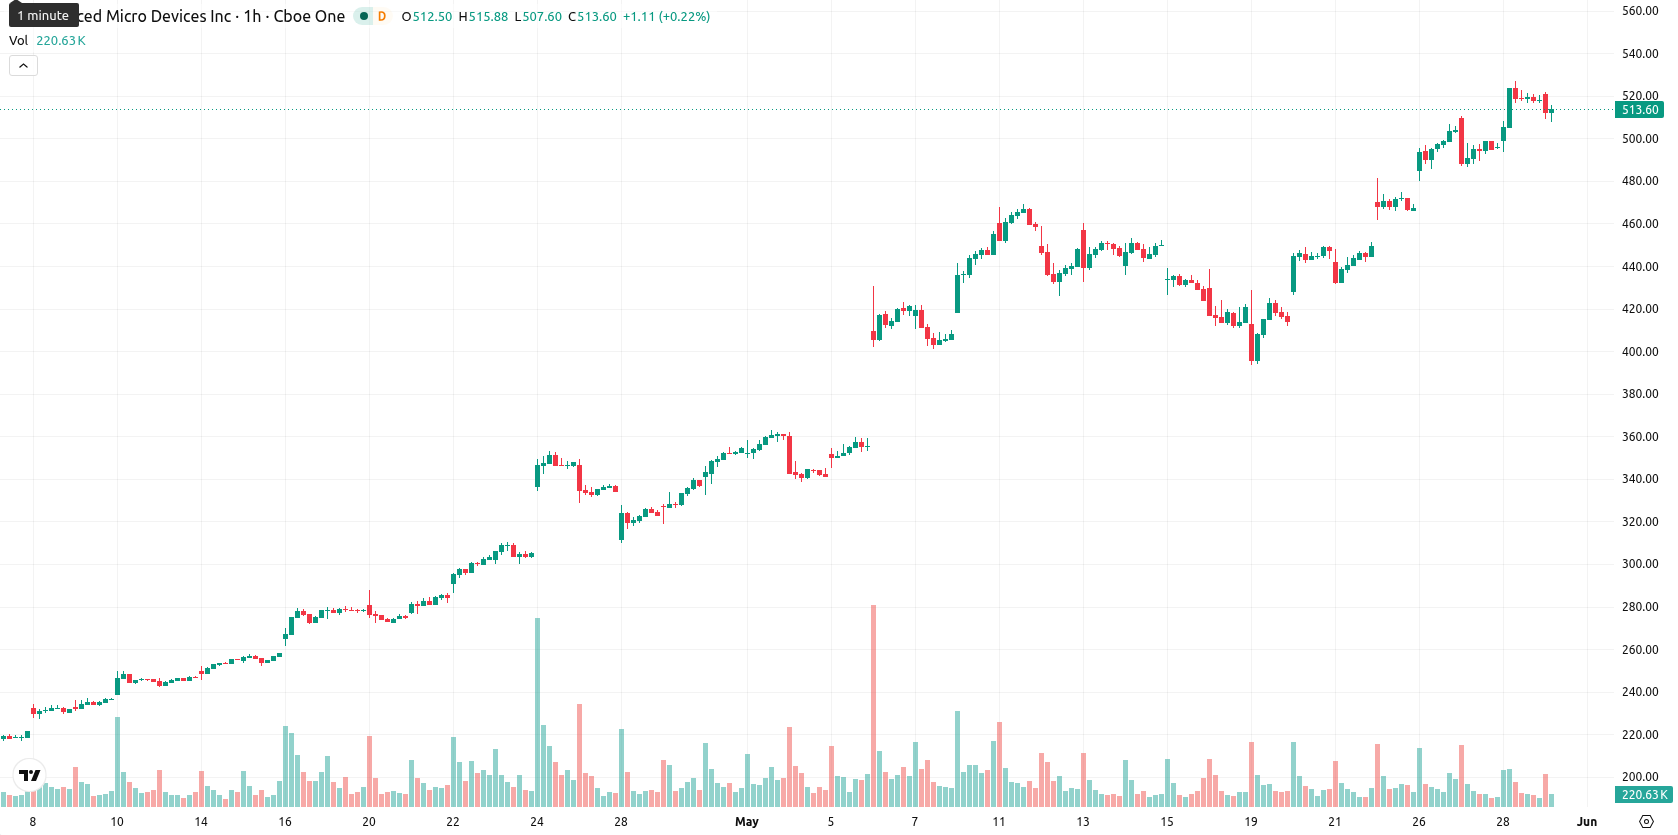
Advanced Micro Devices, Inc. (AMD) stock is trading at $513.89, down 0.90% on the day. The price remains well above its key moving averages, indicating continued positive momentum on multiple timeframes.
Highlights
- AMD maintains strong bullish momentum, trading well above major averages across short, medium, and long-term timeframes.
- Despite positive trend indicators, multiple overbought signals and a recent price pullback indicate elevated risk of short-term consolidation.
- Baseline scenario expects AMD to consolidate sideways within $505.00–$540.00, with a probability above 80% for further upward movement.
Bullish signals persist despite overbought conditions and fading momentum
Above the $432.04 (SMA-20), $321.83 (SMA-50), and $235.88 (SMA-200) levels, AMD has maintained significant separation from its key moving averages. The Ichimoku Kijun at $406.62 acts as immediate support. Daily momentum signals, including both MACD and ADX, show strong bullish persistence, reinforced by the Awesome Oscillator. However, the readings for RSI (76.72), CCI (148.45), and BBP (70.94) indicate pronounced overbought conditions, with the Stoch RSI now neutral, reflecting fading momentum at the current highs. The current session shows a pullback after the open, positioning price near the lower end of the day’s range on moderate volatility.
Sideways consolidation forecast as volatility limits downside risk
Over the next five trading days, AMD is expected to consolidate sideways within a typical volatility band of $505.00–$540.00. A baseline scenario calls for continued movement above $505.00, with the probability of further gains assessed as very high. Should the price break above $540.00, additional upward momentum could result, while a decline below $505.00 would open the door to a deeper short-term correction.
Earlier, analysts noted that AMD was demonstrating robust bullish momentum and sustained buyer control across multiple timeframes. The current setup confirms this ongoing strength but highlights that with technicals remaining firmly overbought, traders should be alert for potential volatility spikes if price action moves decisively outside the $505.00–$540.00 band.


-
 Afghanistan
-
 Albania
-
 Algeria
-
 Angola
-
 Argentina
-
 Armenia
-
 Australia
-
 Austria
-
 Azerbaijan
-
 Bahamas
-
 Bahrain
-
 Bangladesh
-
 Belarus
-
 Belgium
-
 Bolivia
-
 Botswana
-
 Brazil
-
 Brunei
-
 Bulgaria
-
 Cambodia
-
 Cameroon
-
 Canada
-
 Chile
Chile
-
 China
China
-
 Colombia
-
 Congo
Congo
-
 Costa Rica
-
 Cote d'Ivoire
-
 Croatia
-
 Cuba
Cuba
-
 Cyprus
-
 Czechia
-
 DR Congo
-
 Denmark
-
 Dominican Republic
-
 Ecuador
-
 Egypt
Egypt
-
 El Salvador
-
 Estonia
-
 Eswatini
-
 Ethiopia
-
 Finland
-
 France
-
 Georgia
-
 Germany
-
 Ghana
Ghana
-
 Greece
-
 Haiti
Haiti
-
 Hong Kong
-
 Hungary
-
 India
India
-
 Indonesia
-
 Iran, Islamic republic
-
 Iraq
Iraq
-
 Ireland
-
 Israel
-
 Italy
Italy
-
 Jamaica
-
 Japan
Japan
-
 Jordan
-
 Kazakhstan
-
 Kenya
Kenya
-
 Korea
Korea
-
 Kuwait
-
 Kyrgyzstan
-
 Laos
Laos
-
 Latvia
-
 Lebanon
-
 Lesotho
-
 Libya
Libya
-
 Lithuania
-
 Luxembourg
-
 Madagascar
-
 Malaysia
-
 Malta
Malta
-
 Mauritius
-
 Mexico
-
 Moldova
-
 Mongolia
-
 Montenegro
-
 Morocco
-
 Mozambique
-
 Myanmar
-
 Namibia
-
 Nepal
Nepal
-
 Netherlands
-
 New Zealand
-
 Nigeria
-
 North Macedonia
-
 Norway
-
 Oman
Oman
-
 Pakistan
-
 Palestine
-
 Panama
-
 Papua New Guinea
-
 Paraguay
-
 Peru
Peru
-
 Philippines
-
 Poland
-
 Portugal
-
 Puerto Rico
-
 Qatar
Qatar
-
 Reunion
-
 Romania
-
 Rwanda
-
 Saudi Arabia
-
 Serbia
-
 Singapore
-
 Slovakia
-
 Slovenia
-
 Somalia
-
 South Africa
-
 Spain
Spain
-
 Sri Lanka
-
 Sweden
-
 Switzerland
-
 Syria
Syria
-
 Taiwan
-
 Tajikistan
-
 Tanzania
-
 Thailand
-
 Trinidad and Tobago
-
 Tunisia
-
 Turkey
-
 UAE
UAE
-
 Uganda
-
 Ukraine
-
 United Kingdom
-
United States
-
 Uruguay
-
 Uzbekistan
-
 Venezuela
-
 Vietnam
-
 Yemen
Yemen
-
 Zambia
-
 Zimbabwe
- Forex
- Crypto
