
Profit outlook below forecasts sends Walmart stock down 3.17%

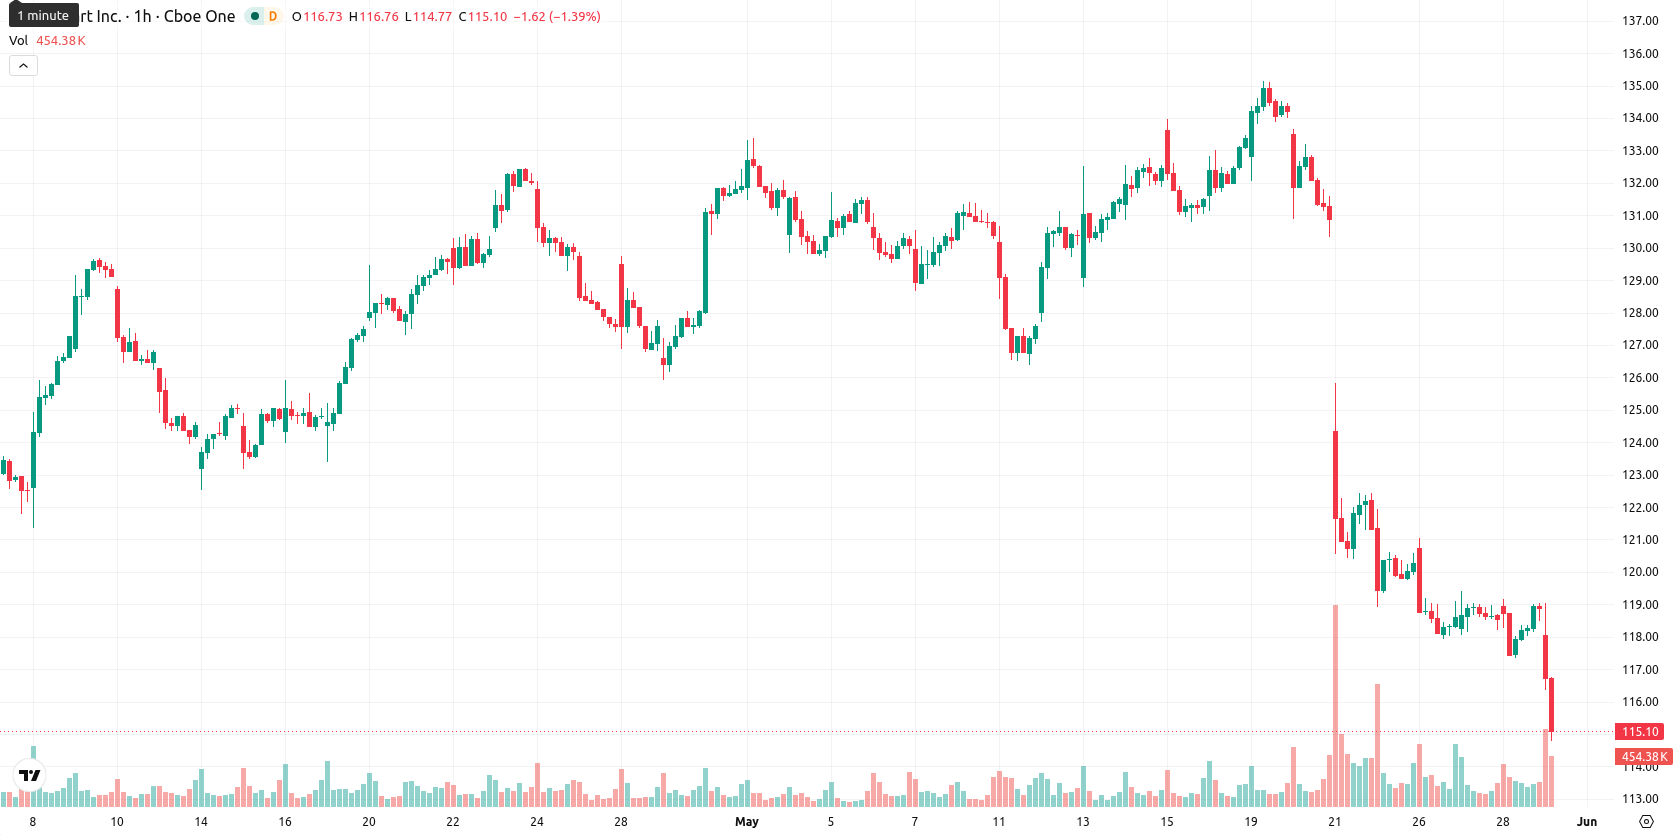
Walmart Inc. (WMT) stock is trading at $115.13 after falling 3.17% on the day. The price sits below its key short- and medium-term moving averages, while holding just above longer-term trend levels.
Highlights
- Walmart reported Q1 revenue of $177.75 billion and EPS of $0.66, meeting profit estimates and surpassing sales forecasts.
- Management lowered full-year EPS guidance to $2.75–$2.85, signaling softer near-term profitability and prompting greater market caution.
- Technicals show persistent downside momentum, with WMT trading below major moving averages and a projected five-day range of $113.00 to $117.50.
Profit guidance miss and insider sale spook investors despite sales beat
Walmart released its first-quarter fiscal 2027 results on May 28, 2026, reporting $177.75 billion in revenue and $0.66 earnings per share, meeting consensus expectations for profit and delivering above-forecast sales. Management's full-year EPS guidance of $2.75–$2.85, which came in below prior analyst estimates, has narrowed the outlook for near-term profitability and shifted market sentiment toward greater caution. Additional factors included the disclosure of a significant planned insider share sale by a Walton-related trust valued at over $366 million, as well as ongoing share buybacks and a raised annualized dividend to $0.99 per share, with the announcement of a rapid delivery expansion also noted.
Downside momentum dominates amid technical breakdown and oversold readings
Technically, WMT is trading below the SMA-20 at $128.23 and SMA-50 at $126.56, while just above important longer-term support at the SMA-200 ($115.01). The Ichimoku Kijun on the daily chart is situated at $126.26, marking the nearest overhead resistance. Momentum readings remain suppressed: the daily MACD is in sell mode, ADX stands at 13.34 indicating a weak trend, and the RSI is at 32.76, within the sell zone. Both Stoch RSI and CCI are deeply oversold, and Bull/Bear Power (BBP) sits at -5.80, confirming seller dominance. The Awesome Oscillator is also signaling sell, and the session began with a minor gap down from $118.90 to $118.57, culminating near session lows, highlighting continued volatility and downside momentum intraday.
Volatility prevails as key support and resistance levels define outlook
Over the next five trading days, WMT is likely to remain within a volatility band of $113.00 to $117.50, close to current levels. A bullish scenario would see the price regaining $117.50 with a subsequent attempt to challenge immediate resistance at $126.26. If pressure persists and the stock breaks below $113, further losses are possible before buyers reemerge near the 200-day moving average.
Earlier, analysts noted that valuation in the retail sector has been heavily shaped by membership-driven revenue streams and evolving patterns of customer loyalty, with companies like Walmart trading at a premium to staples peers due in part to resilient fee and renewal models. With Walmart now entering a phase of compressed earnings guidance, insider share sales, and increased technical weakness, traders should monitor whether support near the 200-day moving average can withstand further downside pressure in the coming sessions.


-
 Afghanistan
-
 Albania
-
 Algeria
-
 Angola
-
 Argentina
-
 Armenia
-
 Australia
-
 Austria
-
 Azerbaijan
-
 Bahamas
-
 Bahrain
-
 Bangladesh
-
 Belarus
-
 Belgium
-
 Bolivia
-
 Botswana
-
 Brazil
-
 Brunei
-
 Bulgaria
-
 Cambodia
-
 Cameroon
-
 Canada
-
 Chile
Chile
-
 China
China
-
 Colombia
-
 Congo
Congo
-
 Costa Rica
-
 Cote d'Ivoire
-
 Croatia
-
 Cuba
Cuba
-
 Cyprus
-
 Czechia
-
 DR Congo
-
 Denmark
-
 Dominican Republic
-
 Ecuador
-
 Egypt
Egypt
-
 El Salvador
-
 Estonia
-
 Eswatini
-
 Ethiopia
-
 Finland
-
 France
-
 Georgia
-
 Germany
-
 Ghana
Ghana
-
 Greece
-
 Haiti
Haiti
-
 Hong Kong
-
 Hungary
-
 India
India
-
 Indonesia
-
 Iran, Islamic republic
-
 Iraq
Iraq
-
 Ireland
-
 Israel
-
 Italy
Italy
-
 Jamaica
-
 Japan
Japan
-
 Jordan
-
 Kazakhstan
-
 Kenya
Kenya
-
 Korea
Korea
-
 Kuwait
-
 Kyrgyzstan
-
 Laos
Laos
-
 Latvia
-
 Lebanon
-
 Lesotho
-
 Libya
Libya
-
 Lithuania
-
 Luxembourg
-
 Madagascar
-
 Malaysia
-
 Malta
Malta
-
 Mauritius
-
 Mexico
-
 Moldova
-
 Mongolia
-
 Montenegro
-
 Morocco
-
 Mozambique
-
 Myanmar
-
 Namibia
-
 Nepal
Nepal
-
 Netherlands
-
 New Zealand
-
 Nigeria
-
 North Macedonia
-
 Norway
-
 Oman
Oman
-
 Pakistan
-
 Palestine
-
 Panama
-
 Papua New Guinea
-
 Paraguay
-
 Peru
Peru
-
 Philippines
-
 Poland
-
 Portugal
-
 Puerto Rico
-
 Qatar
Qatar
-
 Reunion
-
 Romania
-
 Rwanda
-
 Saudi Arabia
-
 Serbia
-
 Singapore
-
 Slovakia
-
 Slovenia
-
 Somalia
-
 South Africa
-
 Spain
Spain
-
 Sri Lanka
-
 Sweden
-
 Switzerland
-
 Syria
Syria
-
 Taiwan
-
 Tajikistan
-
 Tanzania
-
 Thailand
-
 Trinidad and Tobago
-
 Tunisia
-
 Turkey
-
 UAE
UAE
-
 Uganda
-
 Ukraine
-
 United Kingdom
-
United States
-
 Uruguay
-
 Uzbekistan
-
 Venezuela
-
 Vietnam
-
 Yemen
Yemen
-
 Zambia
-
 Zimbabwe
- Forex
- Crypto
