
Bit Digital stock drops 4.55% as sellers take charge after early buy attempts fail

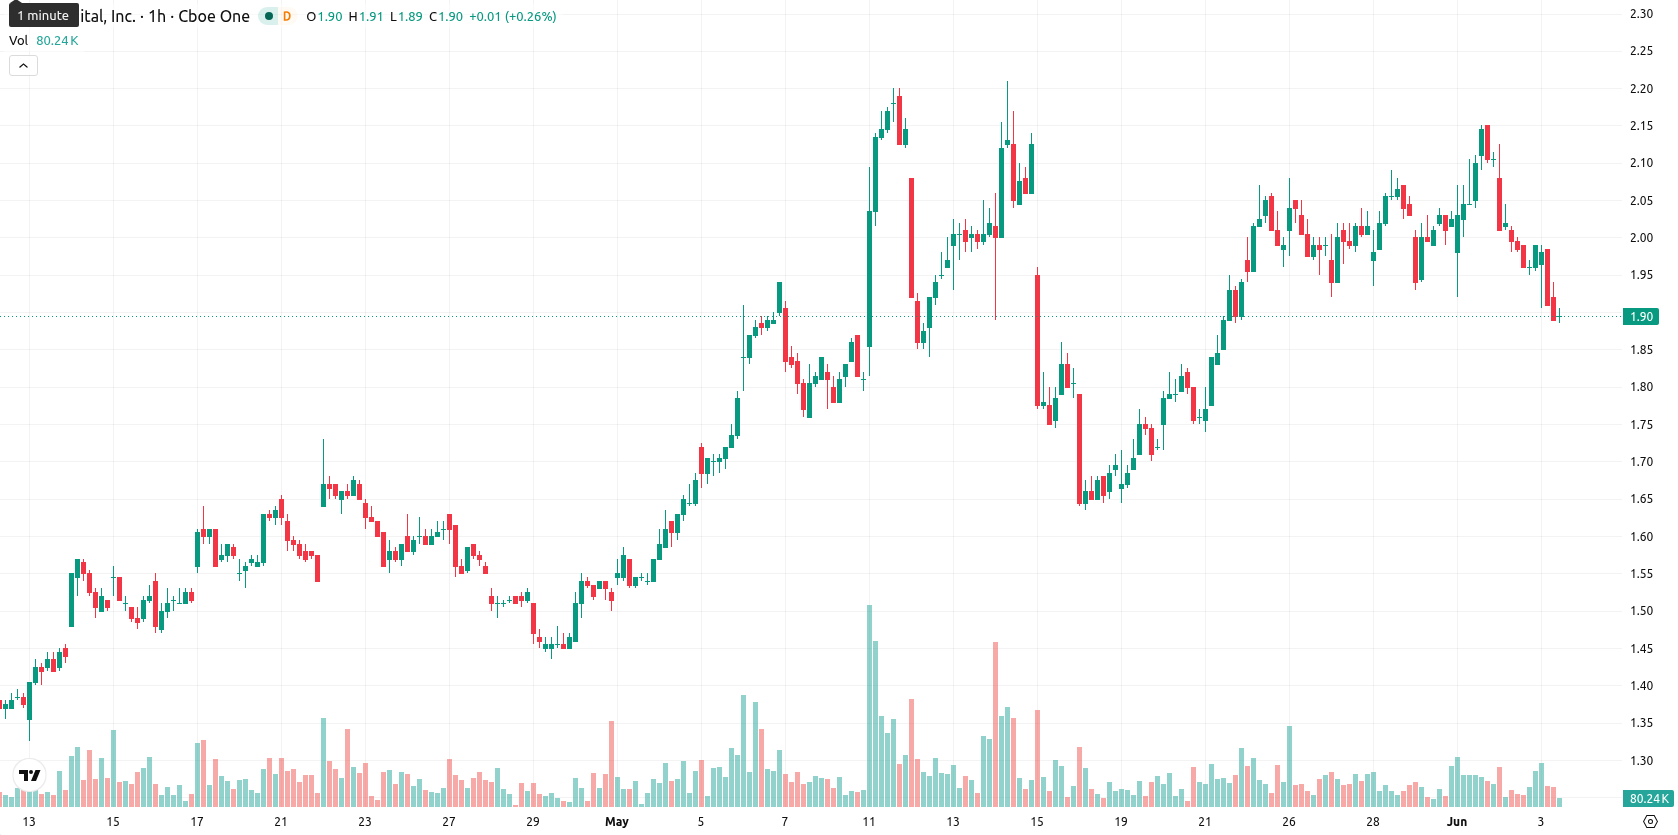
Bit Digital Inc. (BTBT) stock is trading at $1.89, marking a daily decline of 4.55%. The price currently sits below its key short-term moving averages and above intermediate-term averages, demonstrating notable intraday downside action.
Highlights
- BTBT faces near-term resistance and longer-term downside as it trades below key moving averages.
- Indicators present mixed signals; medium-term momentum is supportive, but daily action reveals clear selling pressure.
- Expect a sideways trading range of $1.75–$2.05, with higher probability for a move lower if $1.83 support fails.
Mixed momentum as support holds but sellers drive session low
On the technical front, BTBT is positioned below the 20-day simple moving average ($1.94), above the 50-day ($1.66), and below the 200-day ($2.31). The Ichimoku Kijun line on the daily timeframe stands at $1.83, now acting as immediate support. Among momentum indicators, the daily ADX is 27.73 and MACD is at 0.12, both showing pockets of underlying buyer strength. Stoch RSI reads 38.74 (Sell), CCI prints 60.97 (Buy), and RSI stands at 55.50 (Buy), overall reflecting neutral to mildly positive momentum. Bull/Bear Power at 0.17 (Strong Buy) indicates buyers retained influence during intraday sessions despite the day's price drop. However, positioning near the session low, following a gap at the open, signals sellers maintained control through most of the session.
Low upside odds as downside risk rises below key support
Looking ahead, BTBT is expected to trade within a typical volatility band between $1.75 and $2.05 over the coming week. The probability of a price increase is assessed as low—under 20%—with heightened risk of further declines, especially if the $1.83 Kijun level fails. The baseline scenario is a sideways move inside $1.75 – $2.05. A bullish reversal would be signaled by a sustained close above $2.05, opening room for a recovery toward prior resistance, while a break below $1.83 could trigger a move down to $1.75 or lower.
Earlier, analysts noted that Bit Digital was consolidating with longer-term resistance, and elevated volatility contributing to a cautiously neutral outlook. The recent decline beneath short-term averages and persistent seller control indicate that downside risk has grown, making the $1.83 support level critical for traders to monitor as a potential pivot in the coming sessions.


Latest Bit Digital News


-
 Afghanistan
-
 Albania
-
 Algeria
-
 Angola
-
 Argentina
-
 Armenia
-
 Australia
-
 Austria
-
 Azerbaijan
-
 Bahamas
-
 Bahrain
-
 Bangladesh
-
 Belarus
-
 Belgium
-
 Bolivia
-
 Botswana
-
 Brazil
-
 Brunei
-
 Bulgaria
-
 Cambodia
-
 Cameroon
-
 Canada
-
 Chile
Chile
-
 China
China
-
 Colombia
-
 Congo
Congo
-
 Costa Rica
-
 Cote d'Ivoire
-
 Croatia
-
 Cuba
Cuba
-
 Cyprus
-
 Czechia
-
 DR Congo
-
 Denmark
-
 Dominican Republic
-
 Ecuador
-
 Egypt
Egypt
-
 El Salvador
-
 Estonia
-
 Eswatini
-
 Ethiopia
-
 Finland
-
 France
-
 Georgia
-
 Germany
-
 Ghana
Ghana
-
 Greece
-
 Haiti
Haiti
-
 Hong Kong
-
 Hungary
-
 India
India
-
 Indonesia
-
 Iran, Islamic republic
-
 Iraq
Iraq
-
 Ireland
-
 Israel
-
 Italy
Italy
-
 Jamaica
-
 Japan
Japan
-
 Jordan
-
 Kazakhstan
-
 Kenya
Kenya
-
 Korea
Korea
-
 Kuwait
-
 Kyrgyzstan
-
 Laos
Laos
-
 Latvia
-
 Lebanon
-
 Lesotho
-
 Libya
Libya
-
 Lithuania
-
 Luxembourg
-
 Madagascar
-
 Malaysia
-
 Malta
Malta
-
 Mauritius
-
 Mexico
-
 Moldova
-
 Mongolia
-
 Montenegro
-
 Morocco
-
 Mozambique
-
 Myanmar
-
 Namibia
-
 Nepal
Nepal
-
 Netherlands
-
 New Zealand
-
 Nigeria
-
 North Macedonia
-
 Norway
-
 Oman
Oman
-
 Pakistan
-
 Palestine
-
 Panama
-
 Papua New Guinea
-
 Paraguay
-
 Peru
Peru
-
 Philippines
-
 Poland
-
 Portugal
-
 Puerto Rico
-
 Qatar
Qatar
-
 Reunion
-
 Romania
-
 Rwanda
-
 Saudi Arabia
-
 Serbia
-
 Singapore
-
 Slovakia
-
 Slovenia
-
 Somalia
-
 South Africa
-
 Spain
Spain
-
 Sri Lanka
-
 Sweden
-
 Switzerland
-
 Syria
Syria
-
 Taiwan
-
 Tajikistan
-
 Tanzania
-
 Thailand
-
 Trinidad and Tobago
-
 Tunisia
-
 Turkey
-
 UAE
UAE
-
 Uganda
-
 Ukraine
-
 United Kingdom
-
United States
-
 Uruguay
-
 Uzbekistan
-
 Venezuela
-
 Vietnam
-
 Yemen
Yemen
-
 Zambia
-
 Zimbabwe
- Forex
- Crypto
