
PEP stock holds steady amid signals of oversold conditions from Stochastic RSI: weekly analysis

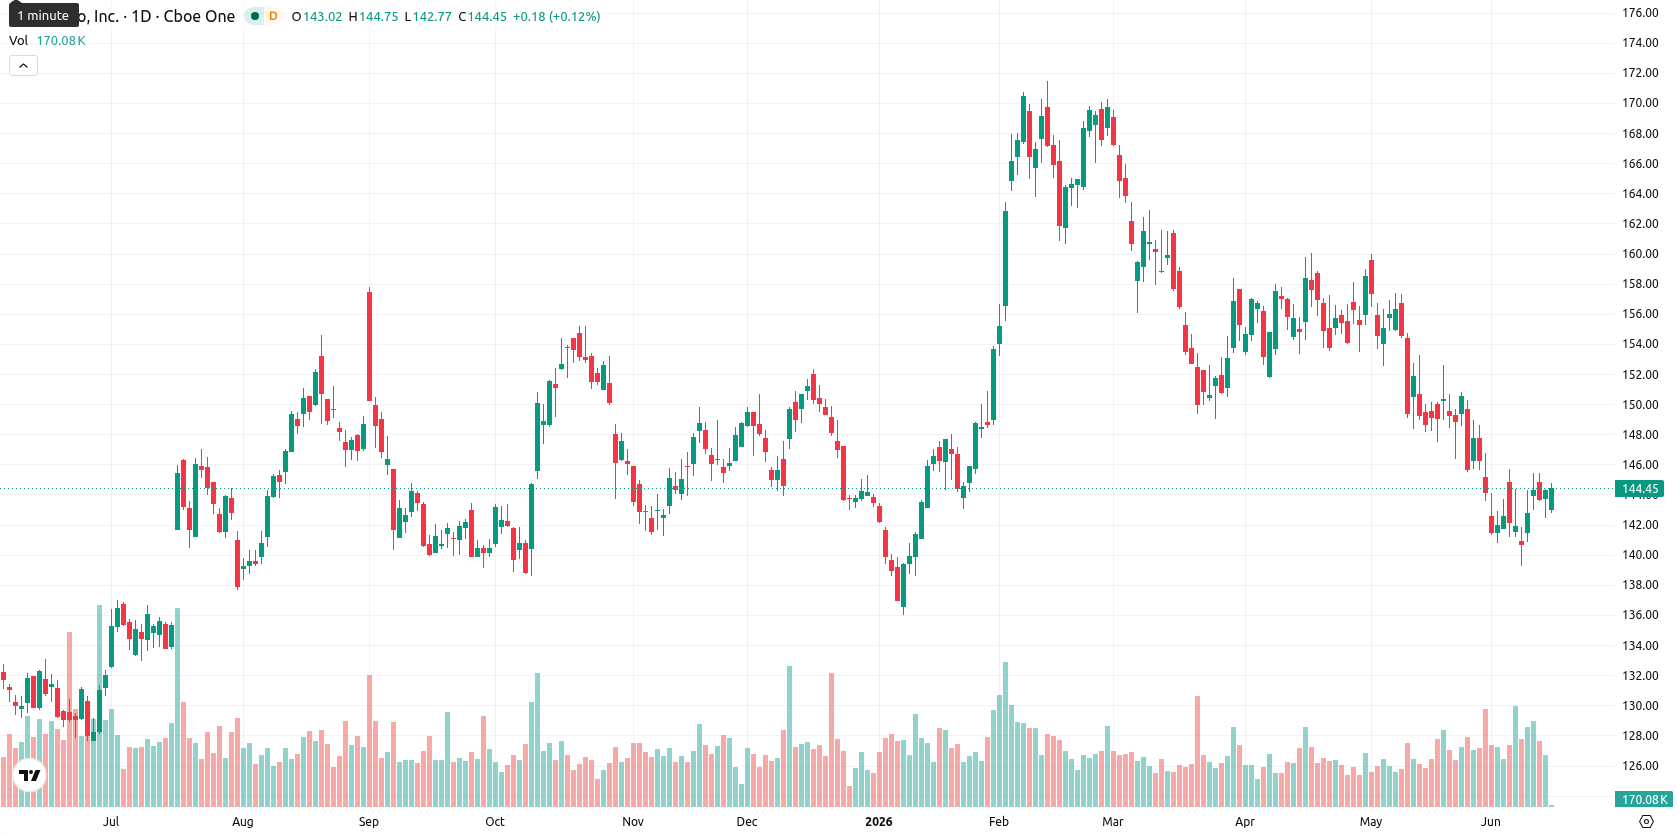
PepsiCo, Inc. (PEP) closed the week at $144.35, posting a mild gain of $0.24 or 0.17%. The stock remains below its major weekly moving averages, including the MA-20 ($155.82), MA-50 ($149.33), and MA-200 ($163.34), indicating persistent medium- and long-term downward pressure, with the MA-50 serving as the nearest dynamic resistance.
Highlights
- PepsiCo trades below major moving averages, indicating sustained selling pressure in both medium- and long-term timeframes.
- Oversold signals dominate weekly momentum and oscillators, yet there is no sign of a strong bullish reversal emerging.
- The stock is forecast to oscillate between $140.00 and $147.00 over the next week, with downside risk prevailing and limited probability of a significant rally.
Earnings and initiatives boost sentiment amid stable dividend outlook
PepsiCo reported its latest quarterly earnings with a year-over-year increase in adjusted earnings per share, highlighting steady financial performance. The company announced a quarterly dividend of $1.48 per share, representing a 4.1% annualized yield, payable on June 30th. Additional developments include the launch of the House of Treats customizable beverages platform for live entertainment and hospitality venues and a new agricultural equipment leasing program in partnership with Compeer Financial to support regenerative farming.
Seller bias holds this week as oversold signals and resistance converge
On the weekly chart, the price remains under key moving averages, with MA-50 and MA-200 capping potential recovery. Support is seen near $140.00, while initial resistance lies at $147.00 — aligned closely with the next technical barrier. Weekly RSI stands at 42.42 and maintains a sell bias; Stochastic RSI and CCI also signal oversold conditions. MACD and ADX both show neutral momentum, with indicators like Bull/Bear Power and the Awesome Oscillator confirming continued seller dominance.
Sideways-to-negative bias expected next week as breakout risks remain low
For the coming five trading days, PepsiCo is expected to trade within the $140.00 to $147.00 range, consistent with recent weekly volatility of 3.27%. Technicals continue to support a sideways to slightly negative outlook, with limited prospects for a strong upside given the lack of buy signals from all four core weekly indicators. Bullish momentum could only emerge if the price decisively moves above $147.00, but this scenario has a low probability. Conversely, a drop below $140.00 would likely result in renewed selling pressure and raise the risk of testing lower support levels.
Earlier, analysts noted that ongoing technical weakness and subdued momentum indicators pointed to a bearish outlook for PepsiCo shares. This view is reinforced by current price action and signals, suggesting that investors should monitor the $140.00 support level for signs of further downside risk in the near term.


-
 Afghanistan
-
 Albania
-
 Algeria
-
 Angola
-
 Argentina
-
 Armenia
-
 Australia
-
 Austria
-
 Azerbaijan
-
 Bahamas
-
 Bahrain
-
 Bangladesh
-
 Belarus
-
 Belgium
-
 Bolivia
-
 Botswana
-
 Brazil
-
 Brunei
-
 Bulgaria
-
 Cambodia
-
 Cameroon
-
 Canada
-
 Chile
Chile
-
 China
China
-
 Colombia
-
 Congo
Congo
-
 Costa Rica
-
 Cote d'Ivoire
-
 Croatia
-
 Cuba
Cuba
-
 Cyprus
-
 Czechia
-
 DR Congo
-
 Denmark
-
 Dominican Republic
-
 Ecuador
-
 Egypt
Egypt
-
 El Salvador
-
 Estonia
-
 Eswatini
-
 Ethiopia
-
 Finland
-
 France
-
 Georgia
-
 Germany
-
 Ghana
Ghana
-
 Greece
-
 Haiti
Haiti
-
 Hong Kong
-
 Hungary
-
 India
India
-
 Indonesia
-
 Iran, Islamic republic
-
 Iraq
Iraq
-
 Ireland
-
 Israel
-
 Italy
Italy
-
 Jamaica
-
 Japan
Japan
-
 Jordan
-
 Kazakhstan
-
 Kenya
Kenya
-
 Korea
Korea
-
 Kuwait
-
 Kyrgyzstan
-
 Laos
Laos
-
 Latvia
-
 Lebanon
-
 Lesotho
-
 Libya
Libya
-
 Lithuania
-
 Luxembourg
-
 Madagascar
-
 Malaysia
-
 Malta
Malta
-
 Mauritius
-
 Mexico
-
 Moldova
-
 Mongolia
-
 Montenegro
-
 Morocco
-
 Mozambique
-
 Myanmar
-
 Namibia
-
 Nepal
Nepal
-
 Netherlands
-
 New Zealand
-
 Nigeria
-
 North Macedonia
-
 Norway
-
 Oman
Oman
-
 Pakistan
-
 Palestine
-
 Panama
-
 Papua New Guinea
-
 Paraguay
-
 Peru
Peru
-
 Philippines
-
 Poland
-
 Portugal
-
 Puerto Rico
-
 Qatar
Qatar
-
 Reunion
-
 Romania
-
 Rwanda
-
 Saudi Arabia
-
 Serbia
-
 Singapore
-
 Slovakia
-
 Slovenia
-
 Somalia
-
 South Africa
-
 Spain
Spain
-
 Sri Lanka
-
 Sweden
-
 Switzerland
-
 Syria
Syria
-
 Taiwan
-
 Tajikistan
-
 Tanzania
-
 Thailand
-
 Trinidad and Tobago
-
 Tunisia
-
 Turkey
-
 UAE
UAE
-
 Uganda
-
 Ukraine
-
 United Kingdom
-
United States
-
 Uruguay
-
 Uzbekistan
-
 Venezuela
-
 Vietnam
-
 Yemen
Yemen
-
 Zambia
-
 Zimbabwe
- Forex
- Crypto
