
WTI crude oil price steadies near $65 as traders weigh support at key trendline

WTI crude oil is trading near $65.60 after a sharp decline that followed a rejection from the $75.00–$76 resistance zone earlier this week. The fall, which began on June 24, broke through the $70 handle and tested support near $64 before stabilizing into a narrow range.
Highlights
- WTI crude consolidates just above $63.60 trendline support after falling from $76
- Bollinger Bands show signs of stabilization; MACD and RSI hint at waning bearish pressure
- Reclaiming $66.60–$67 remains critical for bullish reversal in coming sessions
Price is now consolidating above a rising daily trendline aligned around $63.60, a level that previously held in early June and may once again serve as critical support for bulls.

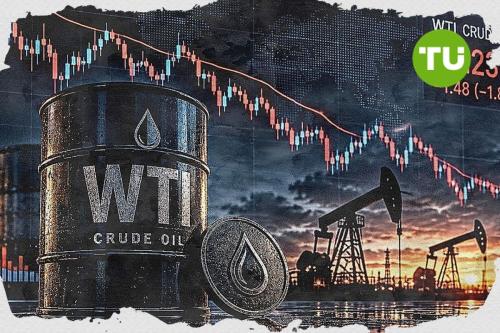
USOIL price dynamics (Source: TradingView)
The daily chart reveals a broader structure of higher lows remains intact, despite the recent volatility. The Bollinger Bands have widened, indicating elevated price action, though the lower band has begun to flatten—suggesting cooling downside momentum. The 200-day EMA, currently near $63.64, adds another layer of structural support. For the bullish case to reassert, price will need to remain above these levels in the sessions ahead.
Momentum signals reflect mixed short-term outlook
On the 4-hour timeframe, technical indicators continue to show weakness, with WTI trading below all major EMAs. The 20 EMA at $66.24 and the 50 EMA at $67.93 now act as near-term dynamic resistance. Price remains capped below the mid-Bollinger Band at $66.01. However, signs of exhaustion are emerging. The RSI on the 30-minute chart has lifted to 52.98, recovering from multiple oversold prints earlier this week. MACD has shown a mild bullish crossover, though with minimal momentum, as the histogram remains flat.
Additionally, the DMI reveals fading trend strength. The -DI has dropped to 33.97 and the ADX is flattening, signaling reduced bearish conviction. Immediate resistance lies at $66.60–$67, where several short-term technical barriers converge. If bulls can break above this zone, upside toward $68.20 and even $70 could be back in play. Conversely, failure to hold above $63.60 risks a deeper move toward $61.
In earlier reports, WTI crude was highlighted as vulnerable beneath the $70 zone, with risk of a breakdown into the $64–$66 region. That decline has now played out, and the current price structure reflects a critical juncture where the market must choose between trend continuation or base formation. For now, the short-term bias remains neutral to bearish unless bulls reclaim key levels.


Latest WTI News


-
 Afghanistan
-
 Albania
-
 Algeria
-
 Angola
-
 Argentina
-
 Armenia
-
 Australia
-
 Austria
-
 Azerbaijan
-
 Bahamas
-
 Bahrain
-
 Bangladesh
-
 Belarus
-
 Belgium
-
 Bolivia
-
 Botswana
-
 Brazil
-
 Brunei
-
 Bulgaria
-
 Cambodia
-
 Cameroon
-
 Canada
-
 Chile
Chile
-
 China
China
-
 Colombia
-
 Congo
Congo
-
 Costa Rica
-
 Cote d'Ivoire
-
 Croatia
-
 Cuba
Cuba
-
 Cyprus
-
 Czechia
-
 DR Congo
-
 Denmark
-
 Dominican Republic
-
 Ecuador
-
 Egypt
Egypt
-
 El Salvador
-
 Estonia
-
 Eswatini
-
 Ethiopia
-
 Finland
-
 France
-
 Georgia
-
 Germany
-
 Ghana
Ghana
-
 Greece
-
 Haiti
Haiti
-
 Hong Kong
-
 Hungary
-
 India
India
-
 Indonesia
-
 Iran, Islamic republic
-
 Iraq
Iraq
-
 Ireland
-
 Israel
-
 Italy
Italy
-
 Jamaica
-
 Japan
Japan
-
 Jordan
-
 Kazakhstan
-
 Kenya
Kenya
-
 Korea
Korea
-
 Kuwait
-
 Kyrgyzstan
-
 Laos
Laos
-
 Latvia
-
 Lebanon
-
 Lesotho
-
 Libya
Libya
-
 Lithuania
-
 Luxembourg
-
 Madagascar
-
 Malaysia
-
 Malta
Malta
-
 Mauritius
-
 Mexico
-
 Moldova
-
 Mongolia
-
 Montenegro
-
 Morocco
-
 Mozambique
-
 Myanmar
-
 Namibia
-
 Nepal
Nepal
-
 Netherlands
-
 New Zealand
-
 Nigeria
-
 North Macedonia
-
 Norway
-
 Oman
Oman
-
 Pakistan
-
 Palestine
-
 Panama
-
 Papua New Guinea
-
 Paraguay
-
 Peru
Peru
-
 Philippines
-
 Poland
-
 Portugal
-
 Puerto Rico
-
 Qatar
Qatar
-
 Reunion
-
 Romania
-
 Rwanda
-
 Saudi Arabia
-
 Serbia
-
 Singapore
-
 Slovakia
-
 Slovenia
-
 Somalia
-
 South Africa
-
 Spain
Spain
-
 Sri Lanka
-
 Sweden
-
 Switzerland
-
 Syria
Syria
-
 Taiwan
-
 Tajikistan
-
 Tanzania
-
 Thailand
-
 Trinidad and Tobago
-
 Tunisia
-
 Turkey
-
 UAE
UAE
-
 Uganda
-
 Ukraine
-
 United Kingdom
-
United States
-
 Uruguay
-
 Uzbekistan
-
 Venezuela
-
 Vietnam
-
 Yemen
Yemen
-
 Zambia
-
 Zimbabwe
- Forex
- Crypto
