

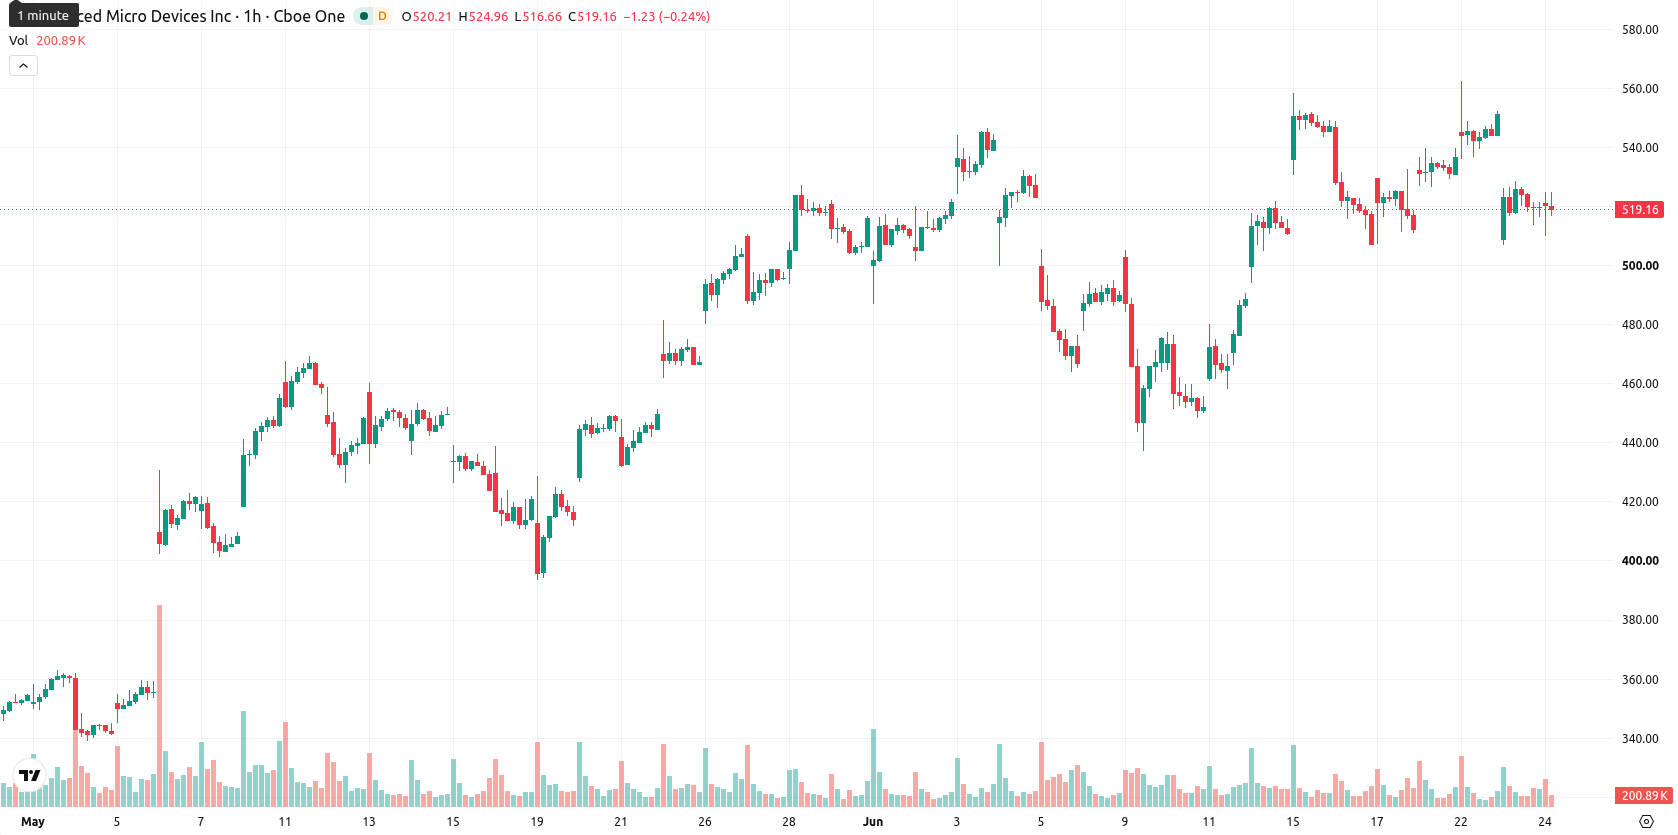
Advanced Micro Devices, Inc. (AMD) stock is trading at $520.94, marking a minimal daily rise of 0.07%. The price currently sits below its key moving averages, reflecting recent downward momentum despite maintaining a position above longer-term supports.
Highlights
- AMD posted Q1 2026 adjusted EPS of $1.37 and revenue of $10.25 billion, both beating expectations and signaling strong operational execution.
- Data center revenue surged 57% year over year to $5.80 billion, cementing this segment as AMD’s primary driver of growth amid rising institutional demand.
- Shares trade below key short- and medium-term moving averages with intraday momentum skewed bearish, while the expected price range is $498.89 to $542.99 pending a break of consolidation.
Data centre gains lift outlook as institutional demand accelerates
Advanced Micro Devices reported Q1 2026 adjusted earnings per share of $1.37, exceeding the consensus estimate and reflecting improved operating efficiency and profitability. Revenue surged 37.8% year on year to $10.25 billion, driven primarily by robust growth in the data centre segment, which grew by 57% to $5.80 billion and highlights increasing institutional demand for AMD's enterprise offerings. CEO Dr Lisa Su further emphasized that growing visibility from MI450 series customer commitments is establishing the data centre as AMD’s major engine for revenue and earnings growth.
Neutral momentum and oversold signals as bearish setup prevails
On the technical front, AMD is trading below both the MA-20 at $532.54 and the MA-50 at $528.4 on the hourly chart, but remains well above the long-term MA-200, which sits at $264.87. The Ichimoku Kijun acts as immediate resistance at $534.9. Intraday momentum is mixed: MACD and ADX are neutral, while the RSI of 39.2, together with Stoch RSI, CCI and BBP, all show oversold or sell signals. The Awesome Oscillator also aligns with a bearish intraday setup, and there is a divergence between oversold oscillators and the lack of positive momentum, which suggests ongoing downside pressure but leaves room for a short-lived technical bounce.
Consolidation likely as breakout requires decisive technical trigger
Looking ahead over the next several sessions, AMD is expected to trade within the $498.89 to $542.99 volatility band relative to current levels. The baseline scenario is consolidation within this range, given the current technical setup and momentum indicators. A bullish breakout would require a sustained close above the $534.9 resistance, while a bearish move would be triggered if AMD breaks below $498.89 support. Both up and down scenarios remain possible, but probabilities currently favor some stabilization, pending a decisive move through either boundary.
In a recent review, analysts highlighted AMD's strong fundamental and technical position, underpinned by robust earnings momentum and sector leadership. The current consolidation phase and mixed short-term signals suggest traders should closely monitor for a decisive move through immediate resistance at $534.9 or support at $498.89, as these levels may determine the direction of the next major trend.


-
 Afghanistan
-
 Albania
-
 Algeria
-
 Angola
-
 Argentina
-
 Armenia
-
 Australia
-
 Austria
-
 Azerbaijan
-
 Bahamas
-
 Bahrain
-
 Bangladesh
-
 Belarus
-
 Belgium
-
 Bolivia
-
 Botswana
-
 Brazil
-
 Brunei
-
 Bulgaria
-
 Cambodia
-
 Cameroon
-
 Canada
-
 Chile
Chile
-
 China
China
-
 Colombia
-
 Congo
Congo
-
 Costa Rica
-
 Cote d'Ivoire
-
 Croatia
-
 Cuba
Cuba
-
 Cyprus
-
 Czechia
-
 DR Congo
-
 Denmark
-
 Dominican Republic
-
 Ecuador
-
 Egypt
Egypt
-
 El Salvador
-
 Estonia
-
 Eswatini
-
 Ethiopia
-
 Finland
-
 France
-
 Georgia
-
 Germany
-
 Ghana
Ghana
-
 Greece
-
 Haiti
Haiti
-
 Hong Kong
-
 Hungary
-
 India
India
-
 Indonesia
-
 Iran, Islamic republic
-
 Iraq
Iraq
-
 Ireland
-
 Israel
-
 Italy
Italy
-
 Jamaica
-
 Japan
Japan
-
 Jordan
-
 Kazakhstan
-
 Kenya
Kenya
-
 Korea
Korea
-
 Kuwait
-
 Kyrgyzstan
-
 Laos
Laos
-
 Latvia
-
 Lebanon
-
 Lesotho
-
 Libya
Libya
-
 Lithuania
-
 Luxembourg
-
 Madagascar
-
 Malaysia
-
 Malta
Malta
-
 Mauritius
-
 Mexico
-
 Moldova
-
 Mongolia
-
 Montenegro
-
 Morocco
-
 Mozambique
-
 Myanmar
-
 Namibia
-
 Nepal
Nepal
-
 Netherlands
-
 New Zealand
-
 Nigeria
-
 North Macedonia
-
 Norway
-
 Oman
Oman
-
 Pakistan
-
 Palestine
-
 Panama
-
 Papua New Guinea
-
 Paraguay
-
 Peru
Peru
-
 Philippines
-
 Poland
-
 Portugal
-
 Puerto Rico
-
 Qatar
Qatar
-
 Reunion
-
 Romania
-
 Rwanda
-
 Saudi Arabia
-
 Serbia
-
 Singapore
-
 Slovakia
-
 Slovenia
-
 Somalia
-
 South Africa
-
 Spain
Spain
-
 Sri Lanka
-
 Sweden
-
 Switzerland
-
 Syria
Syria
-
 Taiwan
-
 Tajikistan
-
 Tanzania
-
 Thailand
-
 Trinidad and Tobago
-
 Tunisia
-
 Turkey
-
 UAE
UAE
-
 Uganda
-
 Ukraine
-
 United Kingdom
-
United States
-
 Uruguay
-
 Uzbekistan
-
 Venezuela
-
 Vietnam
-
 Yemen
Yemen
-
 Zambia
-
 Zimbabwe
- Forex
- Crypto
