

Breakout attempt at C$100.21: Can Suncor Energy stock extend gains?

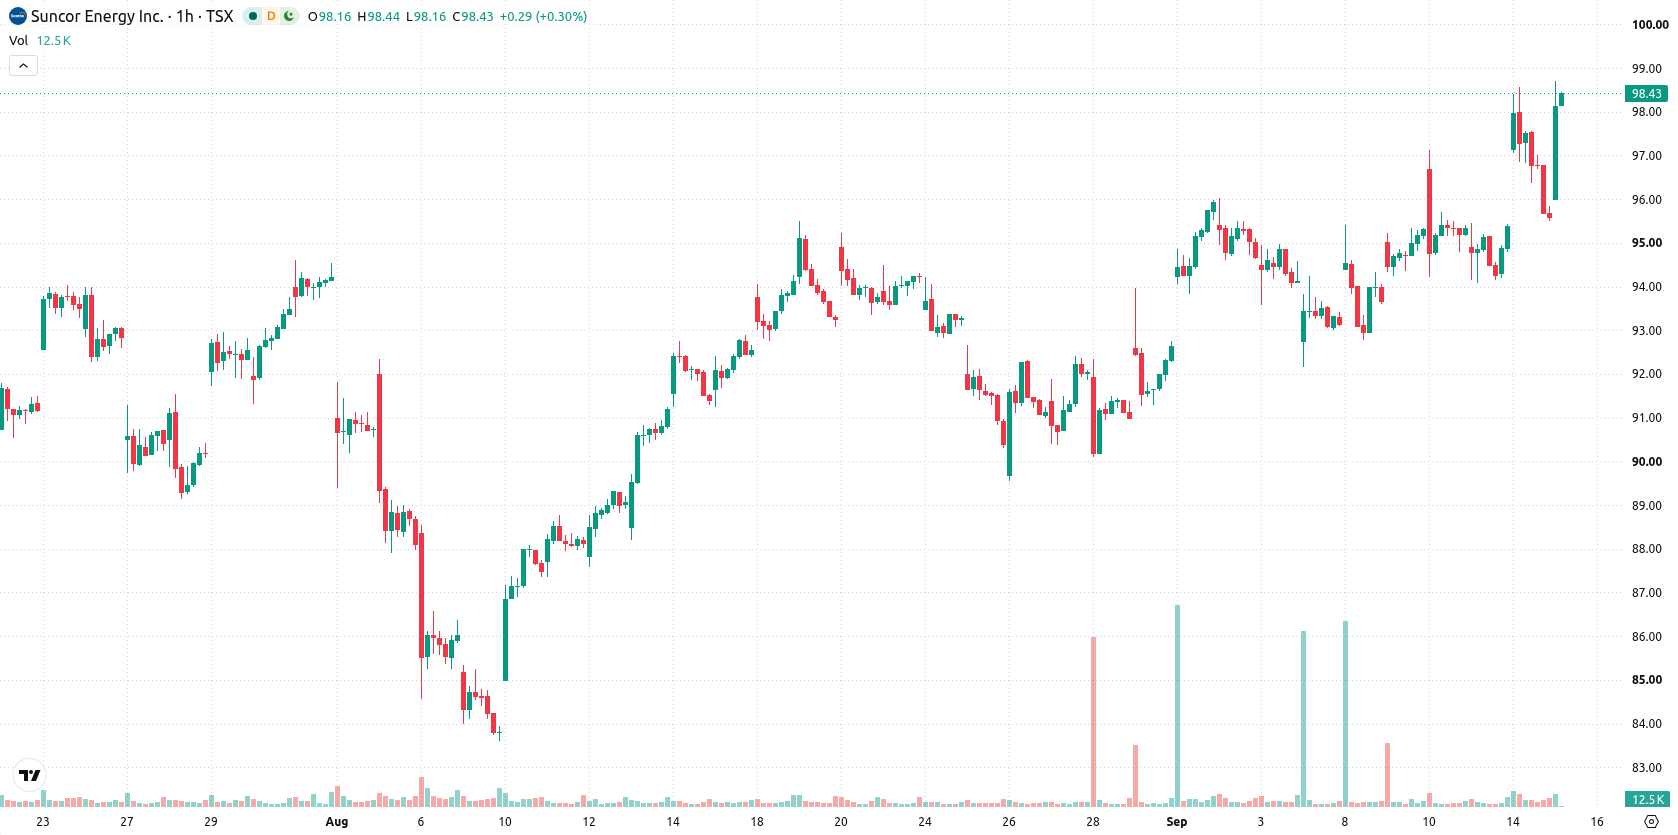
Suncor Energy Inc. (SU) stock is trading at C$98.2 after climbing 2.73% on the day, closing near the session’s high. The price is holding above its key moving averages, reflecting solid momentum.
 108.93
111.42
Highlights
- Price achieved a 2.73% gain to C$98.2, closing near the session high with moderate volatility.
- The stock maintains bullish momentum across all main trend durations but momentum and intraday indicators give mixed-to-neutral signals.
- Price is likely to consolidate between C$93.41 and C$100.21 with high probability of an upside breakout and low risk of testing support.
Uptrend confirmed as technicals diverge on short-term momentum
MA-20 stands at C$95.63, MA-50 at C$94.73, with MA-200 well below at C$81.16, confirming that SU has recently moved well above major support zones. The Ichimoku Kijun, at C$96.32, acts as immediate support. Among momentum indicators, the MACD signals a strong buy and the ADX points to continued buying pressure. However, Stoch RSI and CCI are neutral, while RSI at 50.95 indicates room to run higher. Bull/Bear Power shows sellers maintain control of intraday swings, while the Awesome Oscillator is neutral — reflecting conflict between short-term traders and trend-followers. Today’s move was supported by moderate volatility and a closing gap of 0.9.
Sideways move likely as resistance tests upside potential
SU is expected to consolidate between C$93.41 and C$100.21 over the next few sessions. The most probable scenario involves sideways trading within this range, though a decisive move above resistance could spark further gains. A downside break below support would risk a return toward the lower end of the recent volatility band.
Earlier, analysts noted that Suncor Energy’s technical outlook remained broadly bullish as the stock continued to advance above key support levels despite some mixed momentum signals. The current analysis reinforces this view, with renewed upside momentum and a focus on whether Suncor can decisively clear resistance at C$100.21 to unlock additional gains.






Latest Suncor Energy News


-
 Afghanistan
-
 Albania
-
 Algeria
-
 Angola
-
 Argentina
-
 Armenia
-
 Australia
-
 Austria
-
 Azerbaijan
-
 Bahamas
-
 Bahrain
-
 Bangladesh
-
 Belarus
-
 Belgium
-
 Bolivia
-
 Botswana
-
 Brazil
-
 Brunei
-
 Bulgaria
-
 Cambodia
-
 Cameroon
-
 Canada
-
 Chile
-
 China
-
 Colombia
-
 Congo
-
 Costa Rica
-
 Cote d'Ivoire
-
 Croatia
-
 Cuba
-
 Cyprus
-
 Czechia
-
 DR Congo
-
 Denmark
-
 Dominican Republic
-
 Ecuador
-
 Egypt
-
 El Salvador
-
 Estonia
-
 Eswatini
-
 Ethiopia
-
 Finland
-
 France
-
 Georgia
-
 Germany
-
 Ghana
-
 Greece
-
 Haiti
-
 Hong Kong
-
 Hungary
-
 India
-
 Indonesia
-
 Iran, Islamic republic
-
 Iraq
-
 Ireland
-
 Israel
-
 Italy
-
 Jamaica
-
 Japan
-
 Jordan
-
 Kazakhstan
-
 Kenya
-
 Korea
-
 Kuwait
-
 Kyrgyzstan
-
 Laos
-
 Latvia
-
 Lebanon
-
 Lesotho
-
 Libya
-
 Lithuania
-
 Luxembourg
-
 Madagascar
-
 Malaysia
-
 Malta
-
 Mauritius
-
 Mexico
-
 Moldova
-
 Mongolia
-
 Montenegro
-
 Morocco
-
 Mozambique
-
 Myanmar
-
 Namibia
-
 Nepal
-
 Netherlands
-
 New Zealand
-
 Nigeria
-
 North Macedonia
-
 Norway
-
 Oman
-
 Pakistan
-
 Palestine
-
 Panama
-
 Papua New Guinea
-
 Paraguay
-
 Peru
-
 Philippines
-
 Poland
-
 Portugal
-
 Puerto Rico
-
 Qatar
-
 Reunion
-
 Romania
-
 Rwanda
-
 Saudi Arabia
-
 Serbia
-
 Singapore
-
 Slovakia
-
 Slovenia
-
 Somalia
-
 South Africa
-
 Spain
-
 Sri Lanka
-
 Sweden
-
 Switzerland
-
 Syria
-
 Taiwan
-
 Tajikistan
-
 Tanzania
-
 Thailand
-
 Trinidad and Tobago
-
 Tunisia
-
 Turkey
-
 UAE
-
 Uganda
-
 Ukraine
-
 United Kingdom
-
United States
-
 Uruguay
-
 Uzbekistan
-
 Venezuela
-
 Vietnam
-
 Yemen
-
 Zambia
-
 Zimbabwe
- Forex
- Crypto












