

Multiple oversold signals: Can Verizon stock avoid deeper losses?

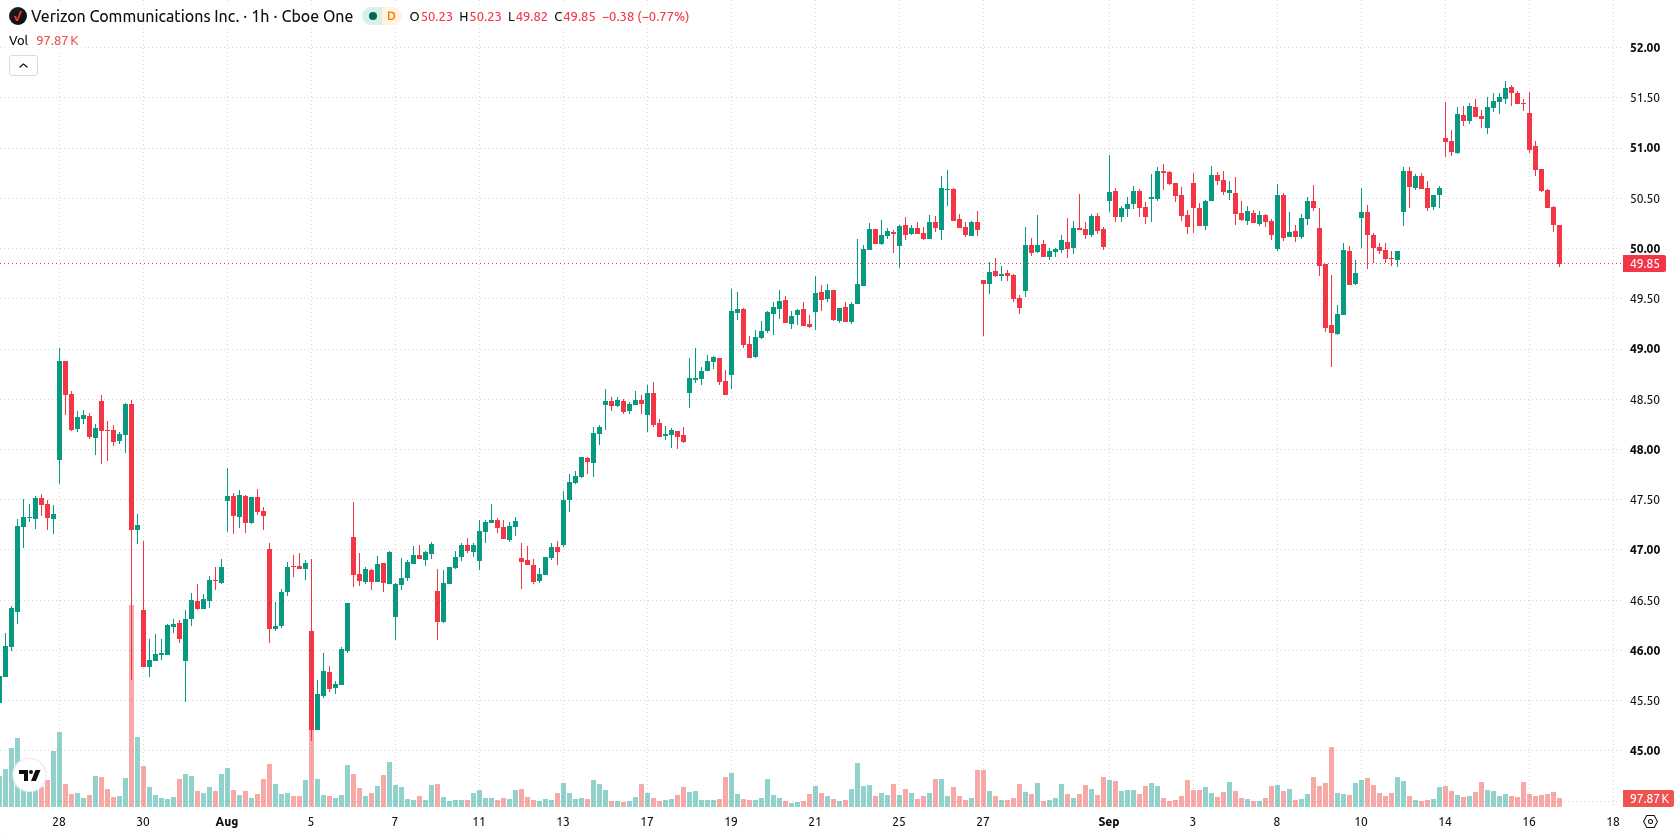
Verizon (VZ) stock is trading at $49.85, having fallen 3.11% on the day. The stock currently sits below its key short- and medium-term moving averages, with the long-term trend showing some support.
 45.16
45.16
Highlights
- Verizon and Samsung completed the first AI-powered Integrated Sensing and Communication trial using 6G technology on Verizon's commercial network.
- Verizon expanded its 6G Innovation Forum by adding nine new major partners to support open 6G ecosystem development.
- Shares of Verizon fell 3.11% to $49.85, trading near session lows with strong seller dominance and a forecasted range of $49.01 to $50.69 over the next 2 to 3 days.
6G trial and expanded partnerships as Verizon leads innovation under pressure
Verizon and Samsung completed the industry's first AI-powered Integrated Sensing and Communication (ISAC) trial on a commercial virtualized network in Dallas on September 14, 2026, demonstrating real-time crowd density heatmapping with 6G sensing technology and 5G antennas, according to Techtimes. The successful test, further detailed by Samsung Electronics via Koreatimes Co., relied on a software-driven, AI-powered virtualized radio access network, underlining Verizon's positioning at the forefront of 6G development. In addition, Verizon formally expanded its 6G Innovation Forum by adding nine major partners, as reported by Communicationstoday Co., reinforcing collaboration on next-generation wireless technologies and open 6G ecosystems, though price action has remained under broader selling pressure.
Mixed momentum and oversold signals as resistance and support converge
VZ/USD is showing clear technical signals: the price remains below the MA-20 and MA-50 levels on the working timeframe, with the MA-200 on the daily chart providing underlying long-term support. The Ichimoku Kijun at $50.74 acts as immediate resistance. Momentum indicators reflect a mixed setup: MACD signals Strong Buy, while ADX points to a Sell. RSI is 37.24 (Sell), and both Stoch RSI and CCI are in oversold territory. Bull/Bear Power also signals an oversold environment with pronounced intraday seller dominance, and the Awesome Oscillator is neutral.
Range-bound outlook as downside risk outweighs upside
In the short term, VZ is likely to consolidate between $49.01 and $50.69, representing the anticipated volatility band for the next 2–3 sessions. The probability of an upward move is 38%, while a downside move is more likely at 62%. The most probable scenario sees continued oscillation within this range; a break above immediate resistance near $50.74 could prompt a move toward the upper end of the forecast, while a drop below $49.01 may lead to further short-term declines.
In a recent review, analysts highlighted Verizon's stable long-term trend and continued operational progress despite periods of short-term weakness and persistent price pressure. Building on this, the current analysis introduces further technical deterioration and reinforces the importance of monitoring the $49.01 support and $50.74 resistance levels as key indicators for the next potential price move.






Latest Verizon News



-
 Afghanistan
-
 Albania
-
 Algeria
-
 Angola
-
 Argentina
-
 Armenia
-
 Australia
-
 Austria
-
 Azerbaijan
-
 Bahamas
-
 Bahrain
-
 Bangladesh
-
 Belarus
-
 Belgium
-
 Bolivia
-
 Botswana
-
 Brazil
-
 Brunei
-
 Bulgaria
-
 Cambodia
-
 Cameroon
-
 Canada
-
 Chile
-
 China
-
 Colombia
-
 Congo
-
 Costa Rica
-
 Cote d'Ivoire
-
 Croatia
-
 Cuba
-
 Cyprus
-
 Czechia
-
 DR Congo
-
 Denmark
-
 Dominican Republic
-
 Ecuador
-
 Egypt
-
 El Salvador
-
 Estonia
-
 Eswatini
-
 Ethiopia
-
 Finland
-
 France
-
 Georgia
-
 Germany
-
 Ghana
-
 Greece
-
 Haiti
-
 Hong Kong
-
 Hungary
-
 India
-
 Indonesia
-
 Iran, Islamic republic
-
 Iraq
-
 Ireland
-
 Israel
-
 Italy
-
 Jamaica
-
 Japan
-
 Jordan
-
 Kazakhstan
-
 Kenya
-
 Korea
-
 Kuwait
-
 Kyrgyzstan
-
 Laos
-
 Latvia
-
 Lebanon
-
 Lesotho
-
 Libya
-
 Lithuania
-
 Luxembourg
-
 Madagascar
-
 Malaysia
-
 Malta
-
 Mauritius
-
 Mexico
-
 Moldova
-
 Mongolia
-
 Montenegro
-
 Morocco
-
 Mozambique
-
 Myanmar
-
 Namibia
-
 Nepal
-
 Netherlands
-
 New Zealand
-
 Nigeria
-
 North Macedonia
-
 Norway
-
 Oman
-
 Pakistan
-
 Palestine
-
 Panama
-
 Papua New Guinea
-
 Paraguay
-
 Peru
-
 Philippines
-
 Poland
-
 Portugal
-
 Puerto Rico
-
 Qatar
-
 Reunion
-
 Romania
-
 Rwanda
-
 Saudi Arabia
-
 Serbia
-
 Singapore
-
 Slovakia
-
 Slovenia
-
 Somalia
-
 South Africa
-
 Spain
-
 Sri Lanka
-
 Sweden
-
 Switzerland
-
 Syria
-
 Taiwan
-
 Tajikistan
-
 Tanzania
-
 Thailand
-
 Trinidad and Tobago
-
 Tunisia
-
 Turkey
-
 UAE
-
 Uganda
-
 Ukraine
-
 United Kingdom
-
United States
-
 Uruguay
-
 Uzbekistan
-
 Venezuela
-
 Vietnam
-
 Yemen
-
 Zambia
-
 Zimbabwe
- Forex
- Crypto












