

Quantum Computing shares drop more than 3% after bearish momentum dominates the session

Quantum Computing Inc. (QUBT) slid 3.22% as firm selling pressure and sustained weakness in technical momentum weighed on the session. The bearish structure is confirmed by the price trading below all key moving averages, with sellers in control and little sign of a near-term reversal.
 6.93
7.73
6.93
7.73
Highlights
- Quantum Computing stock trades below key moving averages, confirming a persistent bearish structure across timeframes.
- Momentum indicators are negative and deep in oversold territory, suggesting firm selling pressure dominates trading activity.
- The stock is forecast to trade between $6.3 and $7.12 over the next 5 days, with a 79% probability of further declines.
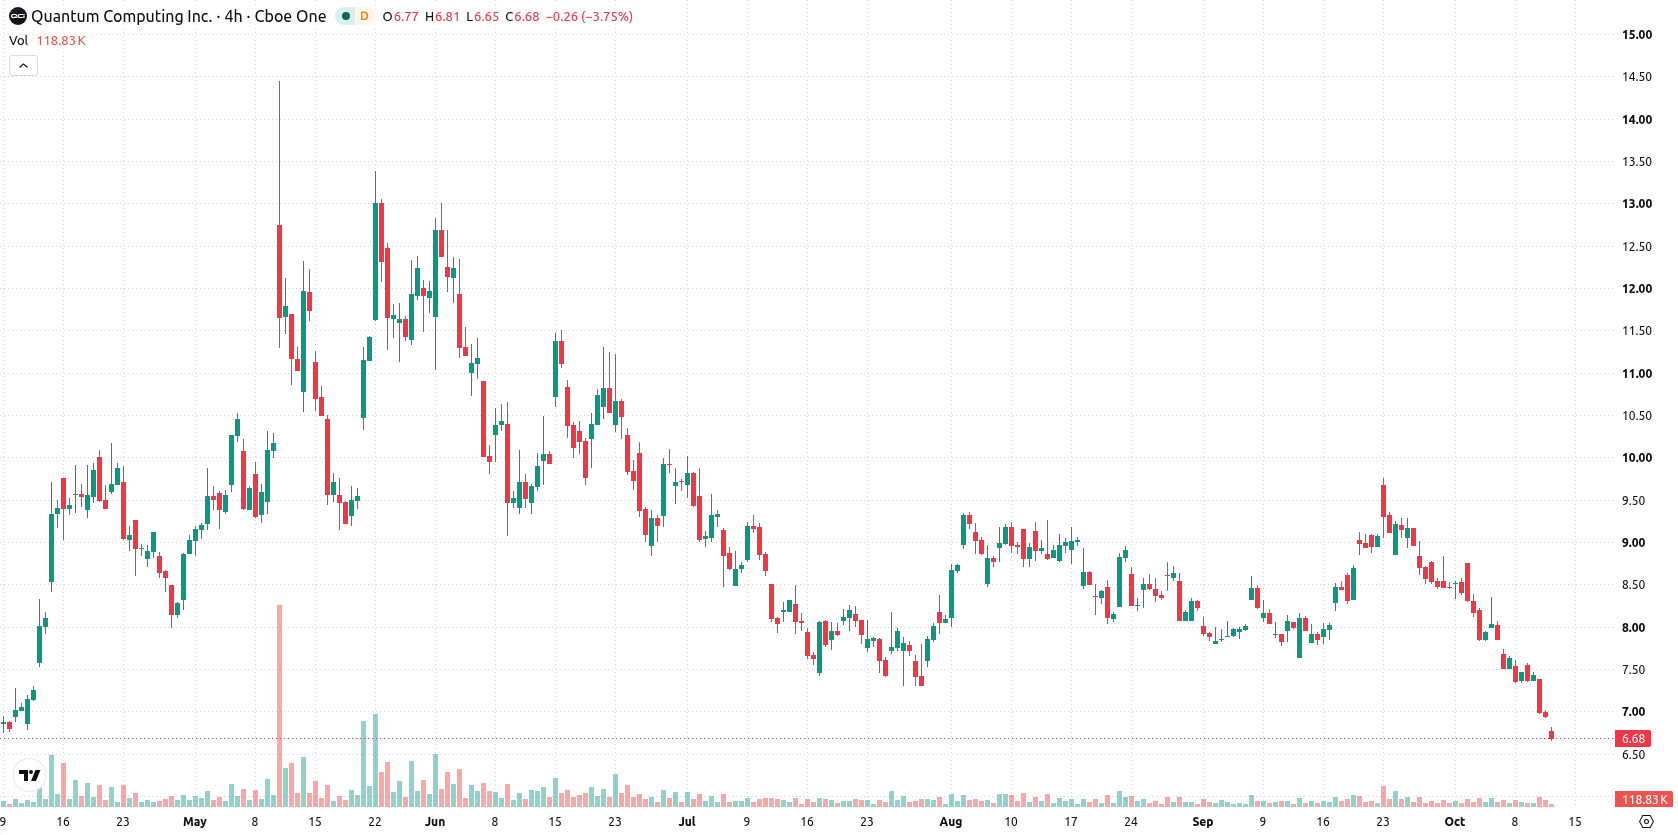
Oversold readings deepen as multi-timeframe bearish signals align
Quantum Computing is trading below its 20-day, 50-day, and 200-day moving averages, with the latest values at $8.28, $8.4, and $9.08 respectively. This alignment signals sustained pressure from sellers across all timeframes, confirming a bearish structure, with immediate resistance near $6.92 and near-term support at $6.3. Momentum signals remain negative, as both MACD and ADX point to weak momentum and lack of trend strength. The RSI at 26.65, Stochastic RSI at 0, and CCI at -161.57 all register deeply oversold readings. BBP stands at -0.49, highlighting seller dominance and an oversold bias for intraday sentiment. The AO is negative, reinforcing the bearish trend. After opening with a 6.35% upside gap, the stock fell $0.22 or 3.22%, with price now near today’s low and intraday volatility at 6.50%. The decline after a strong open, together with momentum signals, depicts firm selling pressure dominating the session.
Earlier, analysts noted that Quantum Computing Inc. was exhibiting sustained bearish momentum and heightened volatility, with sellers firmly in control. The latest price action and technical readings reinforce this view, and traders should closely monitor for any shift above $6.92 or a breakdown below $6.3 as signals of a potential change in direction.





Latest Quantum Computing News






-
 Afghanistan
-
 Albania
-
 Algeria
-
 Angola
-
 Argentina
-
 Armenia
-
 Australia
-
 Austria
-
 Azerbaijan
-
 Bahamas
-
 Bahrain
-
 Bangladesh
-
 Belarus
-
 Belgium
-
 Bolivia
-
 Botswana
-
 Brazil
-
 Brunei
-
 Bulgaria
-
 Cambodia
-
 Cameroon
-
 Canada
-
 Chile
Chile
-
 China
China
-
 Colombia
-
 Congo
Congo
-
 Costa Rica
-
 Cote d'Ivoire
-
 Croatia
-
 Cuba
Cuba
-
 Cyprus
-
 Czechia
-
 DR Congo
-
 Denmark
-
 Dominican Republic
-
 Ecuador
-
 Egypt
Egypt
-
 El Salvador
-
 Estonia
-
 Eswatini
-
 Ethiopia
-
 Finland
-
 France
-
 Georgia
-
 Germany
-
 Ghana
Ghana
-
 Greece
-
 Haiti
Haiti
-
 Hong Kong
-
 Hungary
-
 India
India
-
 Indonesia
-
 Iran, Islamic republic
-
 Iraq
Iraq
-
 Ireland
-
 Israel
-
 Italy
Italy
-
 Jamaica
-
 Japan
Japan
-
 Jordan
-
 Kazakhstan
-
 Kenya
Kenya
-
 Korea
Korea
-
 Kuwait
-
 Kyrgyzstan
-
 Laos
Laos
-
 Latvia
-
 Lebanon
-
 Lesotho
-
 Libya
Libya
-
 Lithuania
-
 Luxembourg
-
 Madagascar
-
 Malaysia
-
 Malta
Malta
-
 Mauritius
-
 Mexico
-
 Moldova
-
 Mongolia
-
 Montenegro
-
 Morocco
-
 Mozambique
-
 Myanmar
-
 Namibia
-
 Nepal
Nepal
-
 Netherlands
-
 New Zealand
-
 Nigeria
-
 North Macedonia
-
 Norway
-
 Oman
Oman
-
 Pakistan
-
 Palestine
-
 Panama
-
 Papua New Guinea
-
 Paraguay
-
 Peru
Peru
-
 Philippines
-
 Poland
-
 Portugal
-
 Puerto Rico
-
 Qatar
Qatar
-
 Reunion
-
 Romania
-
 Rwanda
-
 Saudi Arabia
-
 Serbia
-
 Singapore
-
 Slovakia
-
 Slovenia
-
 Somalia
-
 South Africa
-
 Spain
Spain
-
 Sri Lanka
-
 Sweden
-
 Switzerland
-
 Syria
Syria
-
 Taiwan
-
 Tajikistan
-
 Tanzania
-
 Thailand
-
 Trinidad and Tobago
-
 Tunisia
-
 Turkey
-
 UAE
UAE
-
 Uganda
-
 Ukraine
-
 United Kingdom
-
United States
-
 Uruguay
-
 Uzbekistan
-
 Venezuela
-
 Vietnam
-
 Yemen
Yemen
-
 Zambia
-
 Zimbabwe
- Forex
- Crypto












