
Note: a strong indication that it is the "Cup and Handle" pattern that is forming is the spike on the "bottom" portion of the pattern before the reversal.
6 Best Chart Patterns to Trade Crypto
Updated: April 01, 2024
Editorial Note: While we adhere to strict
Editorial Integrity,
this post may contain references to products from our partners. Here's an explanation for
How We Make Money.
None of the data and information on this webpage constitutes investment advice according to our
Disclaimer.

Chart patterns are visual representations of market sentiment and potential future movements. Popular patterns include Triangles, Psychological Levels, Double Tops/Bottoms, and Head and Shoulders.
-
Key factors affecting pattern effectiveness include market trend, timeframe, and trading volume.
-
No single chart pattern is universally best; effectiveness varies by market conditions and trader strategy.
-
Reading chart patterns involves identification, confirmation, setting take profit and stop loss, and trade entry.
-
Chart patterns offer predictive insights but are influenced by crypto market volatility and subjectivity.
-
Beginners should learn basic patterns, practice with historical charts, use demo accounts and simulators, start small, and combine patterns with other analyses.
In cryptocurrency trading, chart patterns stand as helpful tools for predicting future price movements. These patterns, born from the fluctuations and forms on price charts, offer traders and investors a visual shorthand to anticipate market behavior. Yet, the critical question lingers: do these patterns hold true in the volatile cryptocurrency market as they do in traditional markets?
This article aims to explain chart patterns within the context of crypto trading. By exploring their reliability and effectiveness, we provide valuable insights for traders seeking to navigate the complex and often turbulent crypto waters.
-
How Important Are Chart Patterns In Crypto Trading?
Chart patterns are crucial in crypto trading as they help traders predict future market movements by analyzing past price action, enabling informed decision-making and risk management.
-
How Do You Identify A Cryptocurrency Trading Pattern?
Identifying a cryptocurrency trading pattern involves observing the shape and form of price movements on a chart over time, looking for familiar configurations like triangles, head and shoulders, or double tops and bottoms that suggest future price behavior.
-
What is the easiest way to make money with crypto?
The easiest way to make money with crypto is through buying and holding cryptocurrencies for long-term appreciation, though it requires patience and tolerance to market volatility.
-
How risky is crypto earn?
Crypto earn programs, which allow you to earn interest on your cryptocurrency holdings, carry risk due to market volatility, potential regulatory changes, and the security of the platform holding your assets.
Top Chart Patterns to Learn
Here’s a list of some of the best chart patterns for crypto trading:
-
Triangles (Symmetrical, Ascending, and Descending): Triangles signal continuation or reversal based on their breakout direction. They are pivotal in determining future price actions in a consolidating market.
-
Psychological Levels (e.g., testing $60,000 on BTC/USD): Psychological levels play a significant role in crypto trading, acting as strong resistance or support levels. Breaking these levels can lead to significant price movements.
-
Double Top / Bottom: These patterns signal a reversal after a strong upward or downward trend, indicating that the market is failing to push beyond a certain level.
-
Triple Top / Bottom: Similar to double tops and bottoms but with an extra touch point, making them rarer but often more reliable reversal signals.
-
Head and Shoulders (Inverted): This pattern is a strong reversal indicator, with the head and shoulders signaling a bearish reversal and the inverted version a bullish reversal.
-
Cup and Handle: A bullish continuation pattern that resembles a tea cup. The cup represents a period of consolidation, followed by a breakout from the handle.
Triangles
Triangles in cryptocurrency charts signify consolidation before a breakout. They are divided into 3 types:
-
Symmetrical
-
Ascending
-
Descending
Symmetrical triangles indicate potential breakouts in either direction, showing market uncertainty. Ascending triangles, with a flat top and an upward-sloping bottom, signal bullish trends. Conversely, descending triangles suggest bearish trends with a flat bottom and a downward-sloping top.
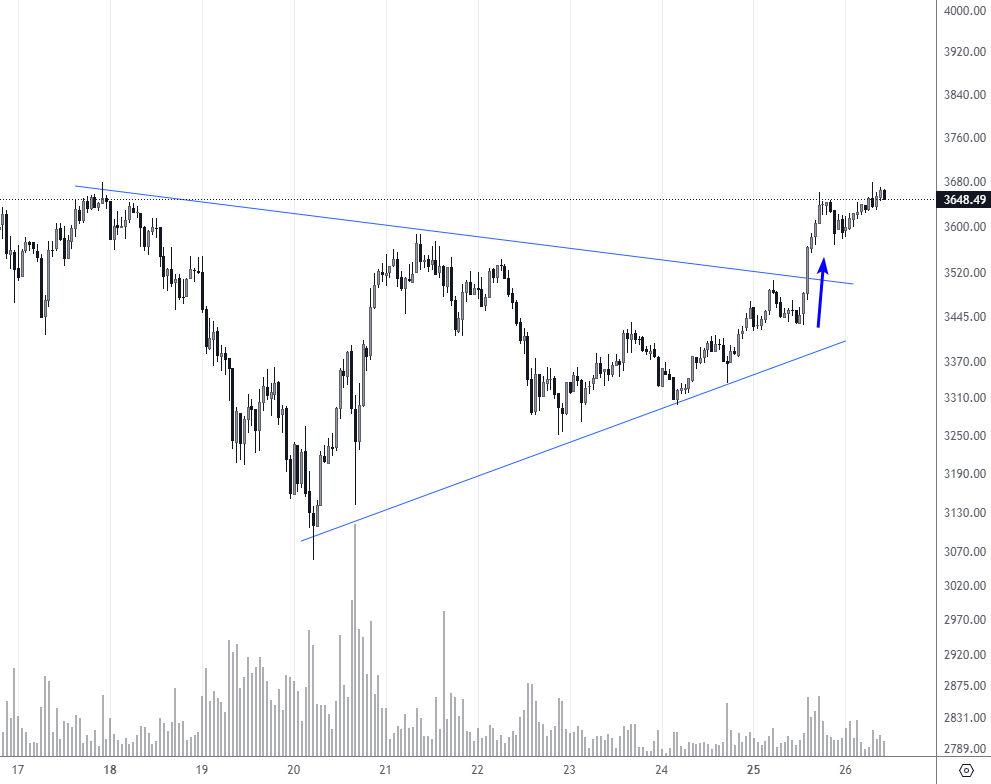
ETH/USD: Bullish Breakout of the Symmetrical Triangle
To trade triangles, monitor for a breakout from the pattern. For symmetrical triangles, wait for the direction to reveal itself. Buy on a breakout above an ascending triangle’s upper trend line, indicating potential upward momentum. Sell or short on a breakout below a descending triangle's lower trend line, predicting further declines. Position entry points just outside the breakout, with stop-loss orders inside the triangle to minimize losses.
Breakouts of triangles can help determine the entry point in the direction of a new trend, see the article with examples for more details: How to Use Triangle Patterns in Trading.
Psychological levels
Psychological levels are significant price points that stand out due to round numbers or historical importance, acting as strong support or resistance. These levels reflect the collective psychology of the market, with prices like $10,000 for Bitcoin commonly serving as barriers due to trader focus and reaction.
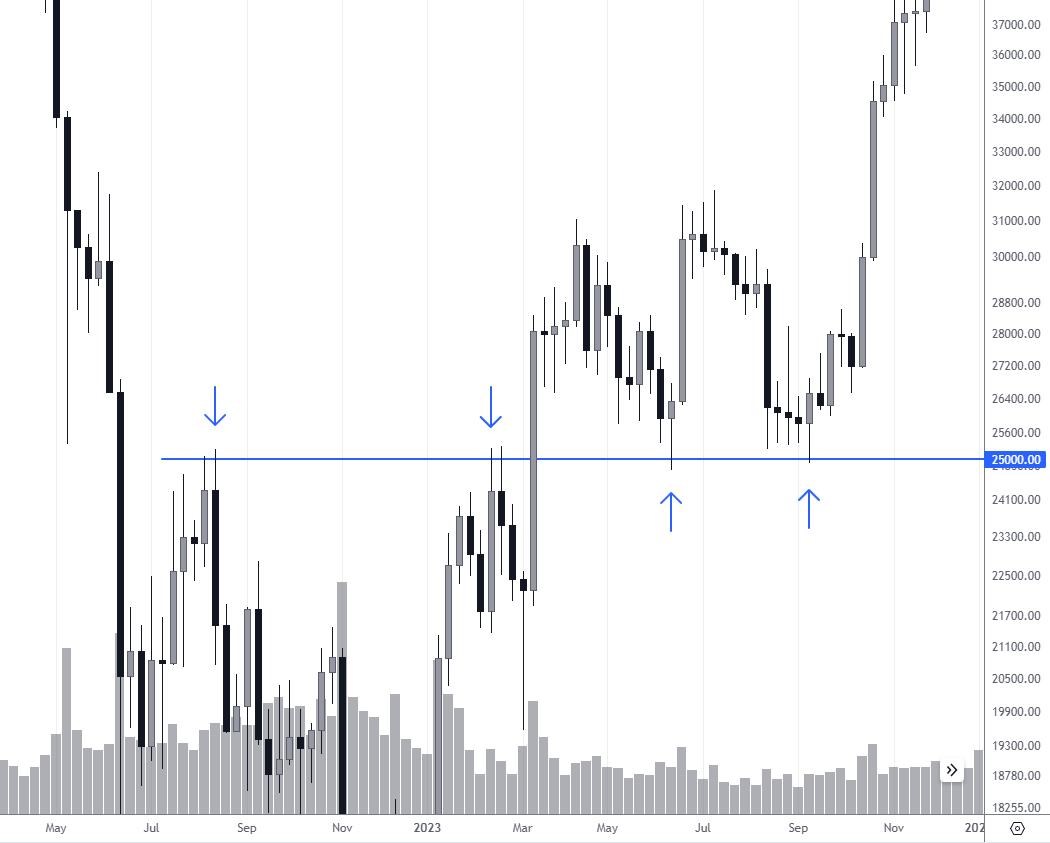
BTC/USD: Price reaction to the $25,000 per Bitcoin level
Trade these levels by anticipating market reactions at these significant points. Consider short positions near psychological resistance if the price shows signs of rejection, indicating a potential drop. For support levels, look for buying opportunities, expecting a bounce. High volume breakouts through psychological levels suggest a strong move beyond, warranting follow-through in the direction of the breakout. Place stop-loss orders strategically beyond these levels to manage risk effectively.
Double top / bottom
The double top is a bearish reversal pattern that appears after an uptrend, marked by two consecutive peaks at approximately the same level, with a valley in between. It signals that the momentum is waning, and a trend reversal is likely. The double bottom, its bullish counterpart, forms after a downtrend with two consecutive lows and a peak in between, indicating a potential reversal to an uptrend.
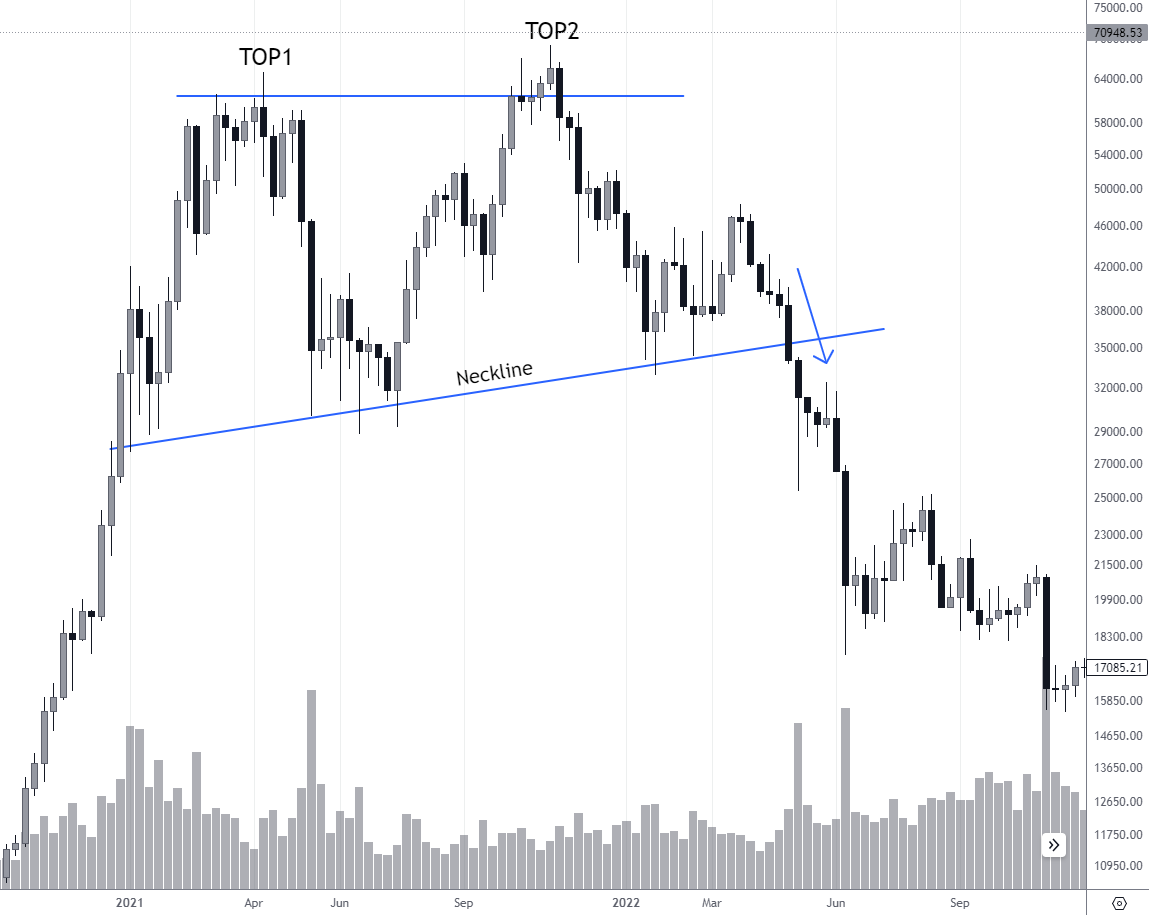
BTC/USD: The famous double top of 2021, where the second peak is just above the first
For double tops, consider taking a short position after the price falls below the valley's support level, confirming the reversal. For double bottoms, a long position could be initiated when the price breaks above the peak's resistance, signaling a potential uptrend. Stop-loss orders are typically placed just outside the pattern's boundary to protect against false breakouts.
More charts and explanations about this trading pattern → in the article: Double Bottom and Double Top Reversal Patterns Review.
Triple top / bottom
The triple top is a more complex and reliable bearish reversal pattern featuring three peaks at a similar level, separated by valleys, indicating strong resistance and potential bearish reversal after an uptrend. The triple bottom displays three lows, suggesting a bullish reversal potential after a downtrend, with the peaks acting as temporary resistance.
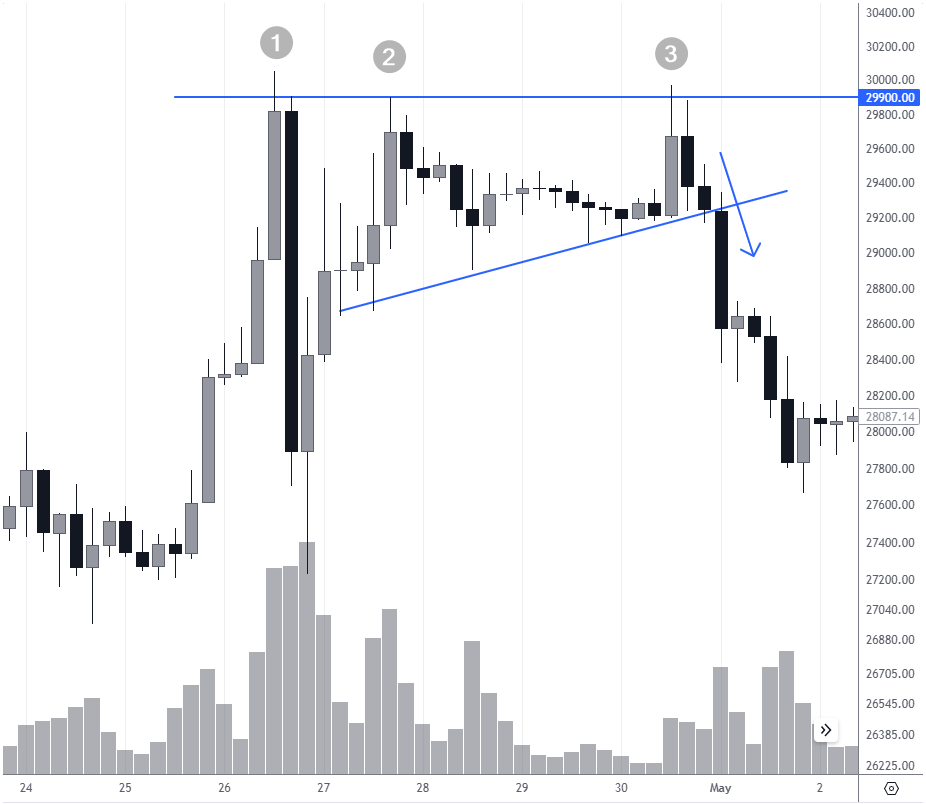
BTC/USD: Triple top on the 4-hour chart
Trading the triple top involves entering a short position once the price falls below the lowest valley, confirming the bearish reversal. For the triple bottom, a long position can be considered when the price breaks above the highest peak, indicating a shift to an uptrend. Place stop-loss orders just above (for triple top) or just below (for triple bottom) the pattern's extremes to manage risk efficiently.
Patterns frame the changing sentiment of market participants, it has to do with psychology and reaction to price changes. Therefore, patterns in Forex and crypto are traded according to the same rules, read more about the triple top pattern → here: How to Use Triple Top Pattern in Forex Trading.
Head and shoulders (inverted)
The inverted head and shoulders pattern is a bullish reversal signal seen at the end of a downtrend. It consists of three troughs: the middle one (head) is the lowest, and the two side ones (shoulders) are higher but approximately at the same level. This pattern suggests that the downtrend is losing momentum, and a reversal to an uptrend is imminent.
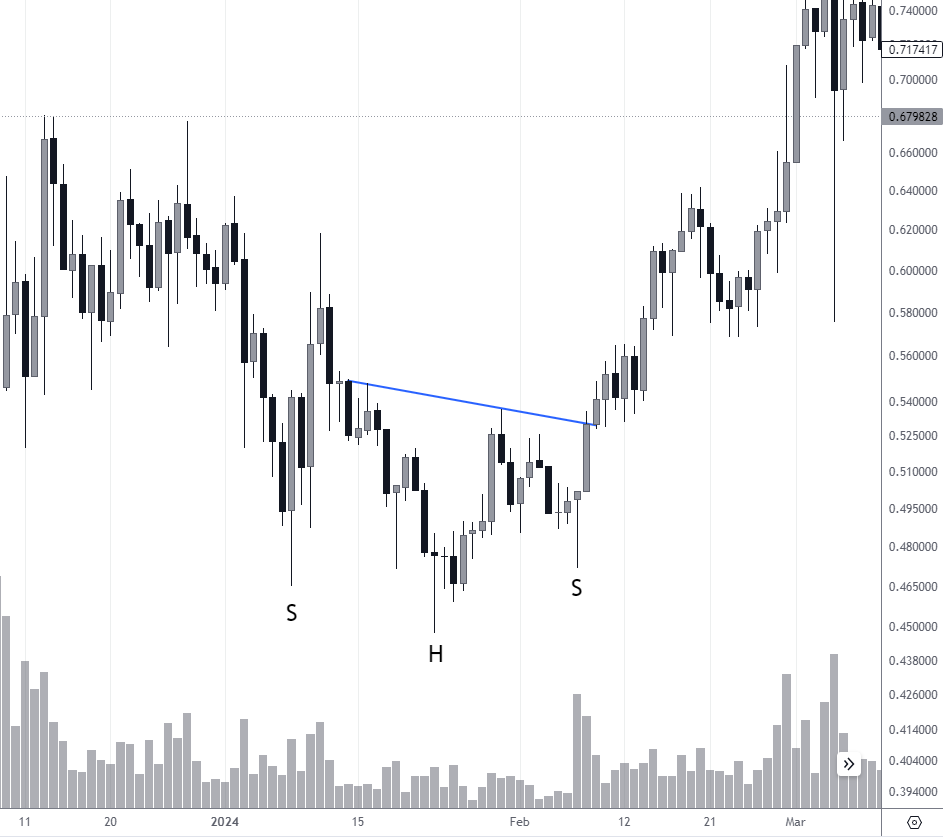
Identifying the neckline, as in this case on the ADA/USD daily chart, can be a subjective decision
To trade this pattern, watch for the price to break above the neckline – the resistance level drawn through the highs of the two troughs. A break above this line confirms the reversal. Traders might enter a long position at this breakout, setting a stop-loss just below the neckline or the right shoulder to minimize potential losses. The profit target can be estimated by the distance from the head to the neckline, projected upwards from the breakout point.
More practically valuable information about this trading pattern with examples on the charts → here: The Head and Shoulders Pattern: How to Spot and Apply It.
Cup and handle
The cup and handle pattern is a bullish continuation formation that resembles a tea cup on the chart. The "cup" forms after a downtrend or consolidation, showing a gradual decline followed by a rise back to the original level. The "handle" appears as a small pullback before the price breaks out to continue the prior uptrend. This pattern indicates bullish sentiment and the potential for an ongoing uptrend.
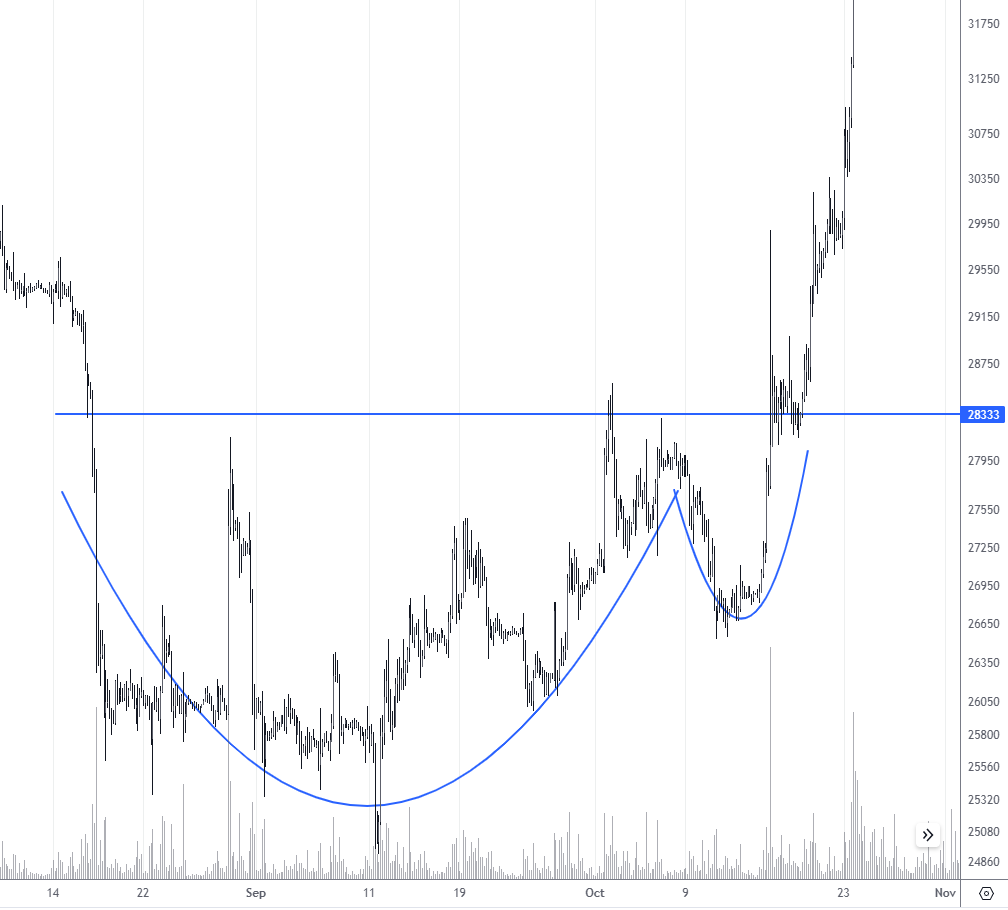
BTC/USD: Example of a ‘Cup and handle’ pattern
To trade the cup and handle, identify the breakout point – typically the highest point of the handle. Enter a long position once the price breaks above this level, signaling a continuation of the bullish trend. Place a stop-loss just below the handle to protect against false breakouts. The profit target is often determined by measuring the depth of the cup and projecting that distance upwards from the breakout point.
Do the chart patterns actually work in crypto trading?
Chart patterns are a cornerstone of technical analysis in financial markets. They are formed by the price movements on a chart and are believed to signify potential future market movements.
In essence, these patterns serve as a language of the market, allowing traders to read and anticipate future price actions based on historical trends. But when it comes to the relatively young and highly volatile cryptocurrency market, the question of their effectiveness becomes more pronounced.
Cryptocurrencies, with their unique market dynamics and influences, present a different challenge for the application of traditional chart patterns. This section delves into the core of chart patterns, aiming to uncover their viability and utility in the fast-paced world of crypto trading.
Learn more about chart patterns in our article Сhart Patterns Cheat Sheet | Common Chart Patterns.
Best crypto exchanges

What you need to know before trading crypto by chart patterns
Before diving into the world of crypto trading with chart patterns as your guide, understanding the influencing factors is crucial. These factors not only affect the formation of patterns but also their reliability and the outcome of your trading decisions.
-
Market Trend: The overall direction of the market is a vital context for any chart pattern. Patterns may indicate different potentials in a bull market compared to a bear market.
-
Timeframe: The time frame on which a pattern forms can significantly impact its reliability. Longer time frames tend to provide more reliable signals than shorter ones due to reduced market noise.
-
Pattern Type: Each chart pattern has its unique implications and reliability. Knowing the specifics of the pattern you're dealing with is essential for making informed decisions.
-
Fundamental Events: Crypto markets are highly sensitive to news and fundamental events. Such events can disrupt pattern formations and lead to unexpected outcomes.
-
Risks: Trading on chart patterns involves risks, especially in the volatile crypto market. It's important to be aware of these risks and manage them effectively.
-
Volume: Trading volume accompanying a pattern can validate its strength. High volume during a pattern breakout is a positive sign, while low volume may indicate a false breakout.
-
Sentiment Analysis: The general sentiment of the market or a particular cryptocurrency can influence pattern effectiveness. Bullish sentiment can strengthen bullish patterns, and vice versa.
-
Pattern Confirmation: Always wait for a pattern to be fully formed and confirmed before making a trade. Premature decisions can lead to misinterpretation of market movements.
What is the best chart pattern to trade crypto?
In the quest for the best chart pattern to trade cryptocurrencies, traders may seek a one-size-fits-all solution. However, the reality is that there is no single "best" chart pattern. The effectiveness of a pattern depends on various factors, including market conditions, the trader's strategy, risk tolerance, and the specific cryptocurrency being traded.
Cryptocurrency markets are renowned for their volatility, which can enhance the effectiveness of certain patterns in specific contexts but diminish their reliability in others. For example, a pattern that works well in a stable, trending market may not perform as expected during high volatility or in the wake of significant news events.
Moreover, each trader's approach and goals are unique. A pattern that suits a short-term scalper looking for quick profits may not be ideal for a long-term investor seeking to identify major trend reversals.
Therefore, rather than searching for the "very best" pattern, traders should focus on understanding a variety of patterns and learning how to apply them effectively in different market scenarios. This approach, coupled with solid risk management and continuous learning, can lead to more consistent success in the dynamic world of crypto trading.
How do you read a chart pattern in crypto?
Reading chart patterns in cryptocurrency trading is a critical skill for identifying potential market movements and making informed decisions. The process can be distilled into a series of actionable steps:
-
Identify: The first step is to recognize a potential chart pattern formation on the price chart. This requires familiarity with various patterns and their implications. Patterns can indicate trend reversals, continuations, or consolidation phases.
-
Confirm: After identifying a potential pattern, confirmation is needed. This involves waiting for the pattern to fully form and for additional signals that support the pattern’s predicted outcome. Confirmation can come from volume indicators, other technical indicators (like moving averages or RSI), or the price breaking through a critical level (such as the neckline in a head and shoulders pattern).
-
Set TP (Take Profit) and SL (Stop Loss): Before entering a trade, it’s important to define exit strategies for both profitable and unprofitable scenarios. Take Profit (TP) is the price level at which you’ll close the trade to realize gains, while Stop Loss (SL) is set to limit potential losses if the market moves against your position. These should be set based on the pattern’s characteristics and the trader's risk tolerance.
-
Enter the Trade: With the pattern confirmed and exit strategies set, the next step is to execute the trade. Entry should be timed based on the pattern’s confirmation signals, such as a breakout on high volume. It’s crucial to adhere to your predefined TP and SL levels to manage risk effectively.
-
Monitor and Adjust: After entering the trade, ongoing monitoring is essential. The crypto market is volatile, and conditions can change rapidly. Be prepared to adjust your TP and SL levels if new information or market movements warrant such changes.
“The key to mastering chart patterns isn't just in recognizing them but in understanding the story they tell about market sentiment. Always pair them with other indicators for a comprehensive view.”

Are chart patterns reliable when trading crypto?
👍 Pros
• Predictive Power: Chart patterns can provide insights into potential future market movements, helping traders to make informed decisions.
• Widespread Use: Many traders rely on chart patterns, which can create self-fulfilling prophecies as traders react similarly to specific formations.
• Risk Management: Patterns allow for clear definitions of entry and exit points, aiding in effective risk management.
• Versatility: Various patterns are applicable in different market conditions, such as trending or consolidation phases.
👎 Cons
• Market Volatility: The high volatility of crypto markets can lead to false signals and the breakdown of patterns unexpectedly.
• Subjectivity: Identifying and interpreting chart patterns can be subjective, leading to different conclusions among traders.
• Lagging Indicator: Chart patterns reflect past market behavior and may not always predict future movements accurately.
• Overreliance: Sole reliance on chart patterns without considering other factors like market news or fundamental analysis can lead to misguided trading decisions.
How should a beginner start trading chart patterns?
-
Learn the Basics: Familiarize yourself with basic chart patterns (e.g., triangles, head and shoulders, double tops/bottoms) and understand their implications.
-
Practice with Historical Charts: Before trading live, practice identifying and trading patterns on historical charts. This helps build recognition skills without financial risk.
-
Use a Demo Account: Many trading platforms offer demo accounts where you can practice trading in real-time market conditions using virtual money.
-
Start Small: When you begin trading with real money, start with small positions to manage risk effectively as you gain experience.
-
Combine with Other Analysis: Enhance chart pattern trading by incorporating other forms of analysis, such as technical indicators and fundamental analysis, to confirm signals and make more informed decisions.
To learn more about trading crypto as a beginner, read our guide How To Trade Crypto With A $100: Beginner's Guide.
Summary
Chart patterns are a fundamental tool in the arsenal of a crypto trader, offering insights into potential market movements and facilitating informed trading decisions. While they come with their own set of challenges, including market volatility and the need for subjective interpretation, their benefits in predictive power and risk management cannot be understated.
For beginners, starting with a solid foundation in understanding chart patterns, coupled with practice and a cautious approach, can pave the way for success in the dynamic world of cryptocurrency trading.


Team that worked on the article

Vuk Martin
Contributor
Vuk stands at the forefront of financial journalism, blending over six years of crypto investing experience with profound insights gained from navigating two bull/bear cycles. A dedicated content writer, Vuk has contributed to a myriad of publications and projects. His journey from an English language graduate to a sought-after voice in finance reflects his passion for demystifying complex financial concepts, making him a helpful guide for both newcomers and seasoned investors.

Dr. BJ Johnson
Developmental English Editor
Dr. BJ Johnson is a PhD in English Language and an editor with over 15 years of experience. He earned his degree in English Language in the U.S and the UK. In 2020, Dr. Johnson joined the Traders Union team. Since then, he has created over 100 exclusive articles and edited over 300 articles of other authors.
Mirjan Hipolito
Cryptocurrency and stock expert
Mirjan Hipolito is a journalist and news editor at Traders Union. She is an expert crypto writer with five years of experience in the financial markets. Her specialties are daily market news, price predictions, and Initial Coin Offerings (ICO).