
Bonk price news: up 7.65% but technicals signal low probability for sustained rebound

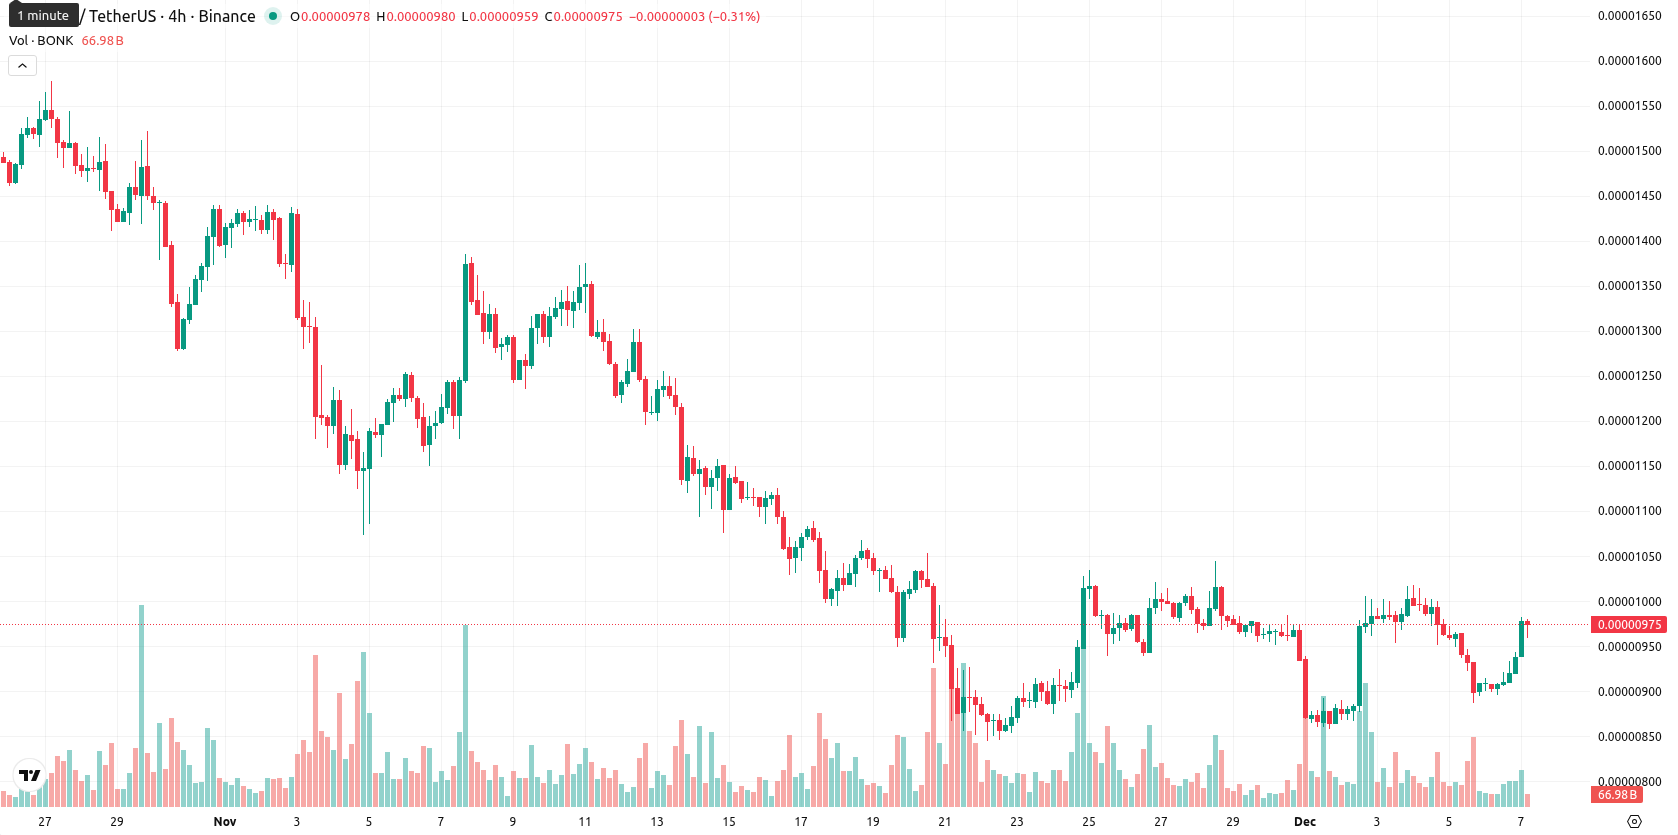
Bonk (BONK) is trading at 0.0000097, which places it slightly above the MA-20 (0.00000960) but well below both the MA-50 (0.00001184) and MA-200 (0.00001906). This setup signals minor short-term upward momentum but sustained medium- and long-term seller pressure, with the Kijun (Ichimoku) at 0.00001110 marking the next resistance while dynamic support lies near the MA-20.
Highlights
- BONK is trading at 0.0000097, marginally above the MA-20 of 0.00000960 but well below MA-50 at 0.00001184 and MA-200 at 0.00001906, indicating persistent medium- and long-term bearish pressure.
- Daily indicators including MACD and ADX remain bearish despite a 7.65% intraday price jump, with RSI, CCI, and BBP reflecting mild seller dominance and neutral-to-oversold conditions.
- The 5-day forecast sees BONK moving sideways in a 0.0000094–0.0000100 range, with less than 20% probability of an upside breakout and increased risk of decline toward 0.0000094 support.
Intraday highs met with weak momentum and mixed signals
Momentum on daily indicators remains weak, with MACD and ADX both projecting a bearish environment, although the daily price has jumped 7.65% after a small gap up from the previous close. RSI, CCI, and BBP point to mild seller dominance and neutral-to-oversold conditions, while Stoch RSI hovers in a neutral state and the Awesome Oscillator offers no clear trend confirmation. BONK is currently near today’s session high of 0.0000098, suggesting moderate intraday volatility and strength toward the upper end, but oscillators and momentum measures show persistent divergence, as short-term buyers lift prices against a backdrop of longer-term weakness.
Bearish scenario expected as upside limited by resistance
Looking ahead, the expected range for the next 5 days is 0.0000094 to 0.0000100, adjusted for typical volatility around the current price due to elevated volatility. The probability of a price increase is very low (less than 20%), making a decline much more likely given bearish signals across D1 and W1 indicators. Baseline scenario calls for sideways movement within the stated range; a bullish case would require a decisive break above 0.00001110, while renewed selling could push BONK down toward dynamic support near 0.0000094.
Previously it was reported that Bonk continued to trade below all major moving averages, with strong downside momentum reflected in negative MACD and a weak RSI while short-term indicators showed mixed exhaustion signals. Support was identified near session lows and resistance near the Ichimoku Kijun, with the expectation of further downside as sellers maintained control — see sellers maintained control — see the latest technical analysis for further detail.


-
 Afghanistan
-
 Albania
-
 Algeria
-
 Angola
-
 Argentina
-
 Armenia
-
 Australia
-
 Austria
-
 Azerbaijan
-
 Bahamas
-
 Bahrain
-
 Bangladesh
-
 Belarus
-
 Belgium
-
 Bolivia
-
 Botswana
-
 Brazil
-
 Brunei
-
 Bulgaria
-
 Cambodia
-
 Cameroon
-
 Canada
-
 Chile
Chile
-
 China
China
-
 Colombia
-
 Congo
Congo
-
 Costa Rica
-
 Cote d'Ivoire
-
 Croatia
-
 Cuba
Cuba
-
 Cyprus
-
 Czechia
-
 DR Congo
-
 Denmark
-
 Dominican Republic
-
 Ecuador
-
 Egypt
Egypt
-
 El Salvador
-
 Estonia
-
 Eswatini
-
 Ethiopia
-
 Finland
-
 France
-
 Georgia
-
 Germany
-
 Ghana
Ghana
-
 Greece
-
 Haiti
Haiti
-
 Hong Kong
-
 Hungary
-
 India
India
-
 Indonesia
-
 Iran, Islamic republic
-
 Iraq
Iraq
-
 Ireland
-
 Israel
-
 Italy
Italy
-
 Jamaica
-
 Japan
Japan
-
 Jordan
-
 Kazakhstan
-
 Kenya
Kenya
-
 Korea
Korea
-
 Kuwait
-
 Kyrgyzstan
-
 Laos
Laos
-
 Latvia
-
 Lebanon
-
 Lesotho
-
 Libya
Libya
-
 Lithuania
-
 Luxembourg
-
 Madagascar
-
 Malaysia
-
 Malta
Malta
-
 Mauritius
-
 Mexico
-
 Moldova
-
 Mongolia
-
 Montenegro
-
 Morocco
-
 Mozambique
-
 Myanmar
-
 Namibia
-
 Nepal
Nepal
-
 Netherlands
-
 New Zealand
-
 Nigeria
-
 North Macedonia
-
 Norway
-
 Oman
Oman
-
 Pakistan
-
 Palestine
-
 Panama
-
 Papua New Guinea
-
 Paraguay
-
 Peru
Peru
-
 Philippines
-
 Poland
-
 Portugal
-
 Puerto Rico
-
 Qatar
Qatar
-
 Reunion
-
 Romania
-
 Rwanda
-
 Saudi Arabia
-
 Serbia
-
 Singapore
-
 Slovakia
-
 Slovenia
-
 Somalia
-
 South Africa
-
 Spain
Spain
-
 Sri Lanka
-
 Sweden
-
 Switzerland
-
 Syria
Syria
-
 Taiwan
-
 Tajikistan
-
 Tanzania
-
 Thailand
-
 Trinidad and Tobago
-
 Tunisia
-
 Turkey
-
 UAE
UAE
-
 Uganda
-
 Ukraine
-
 United Kingdom
-
United States
-
 Uruguay
-
 Uzbekistan
-
 Venezuela
-
 Vietnam
-
 Yemen
Yemen
-
 Zambia
-
 Zimbabwe
- Forex
- Crypto
