
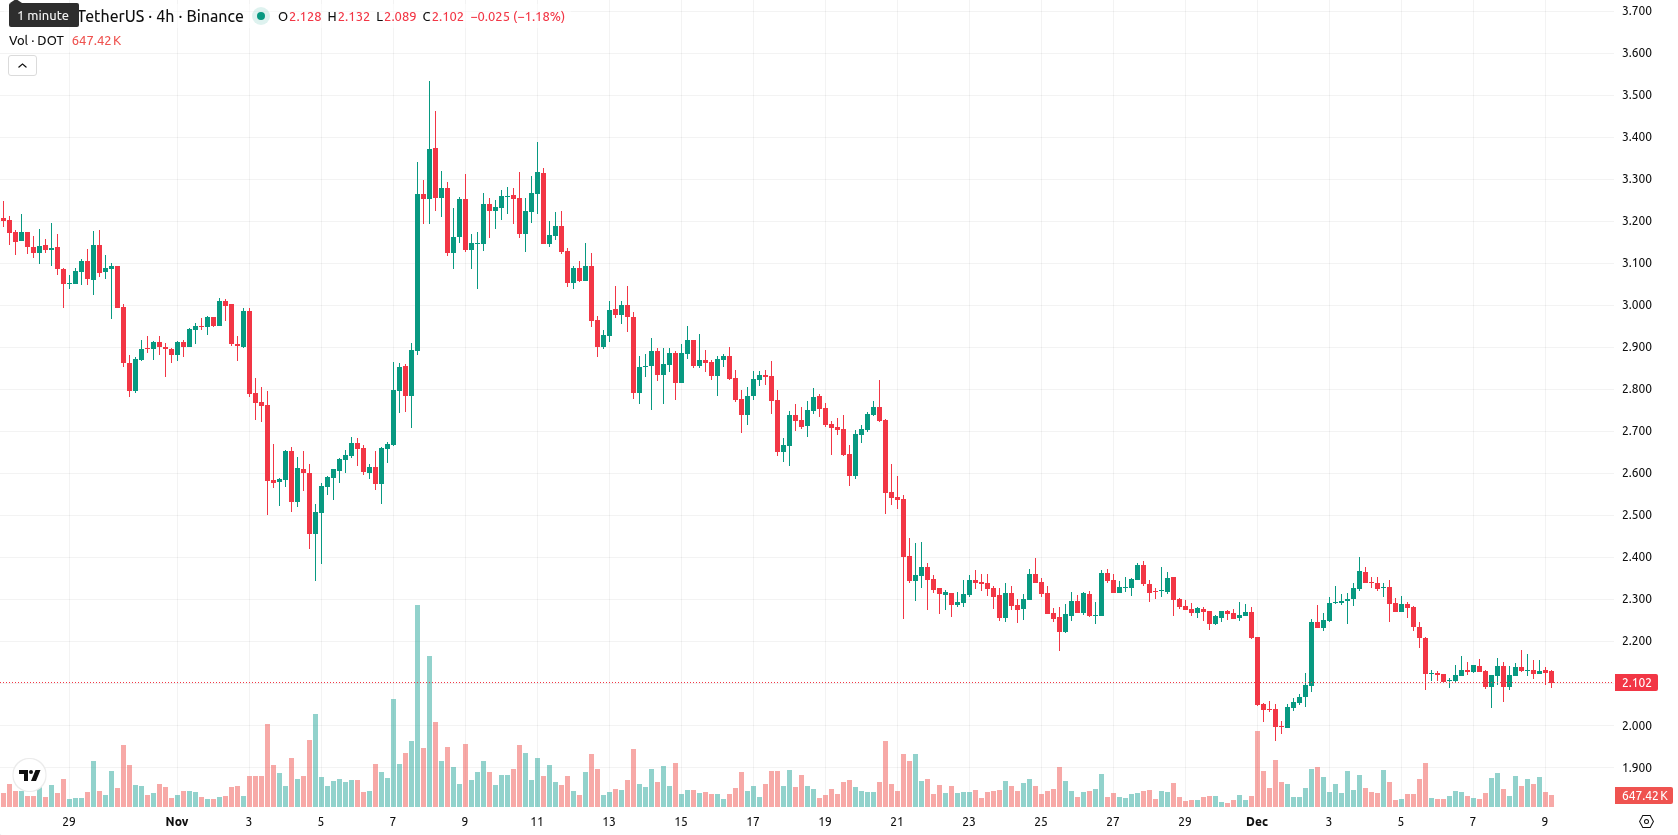
Polkadot dips 1.96% after technical resistance holds firm across key averages

Polkadot (DOT) remains below the MA-20 at $2.281, the MA-50 at $2.682, and the MA-200 at $3.592, signaling seller pressure across short-, medium-, and long-term trends. The nearest dynamic resistance is found at the Kijun level of $2.503, while the most relevant support lies near the lower end of today's range at $2.091.
Highlights
- Polkadot's Relay Chain processed over 32 million transactions in October 2024, signaling strong network activity and increased user participation.
- The Polkadot ecosystem expanded with additional custom parachains and the launch of the Join-Accumulate Machine (JAM) chain to enhance cross-blockchain and Web3 interoperability.
- GoTyme, a Philippine digital bank with over 6.5 million users, began offering crypto trading services including support for Polkadot.
Network expansion and ecosystem upgrades spur user engagement
Polkadot showed robust network activity recently, with its Relay Chain processing over 32 million transactions in October 2024, reflecting high user engagement and a growing number of unique wallets. The ecosystem is expanding further with new custom parachains and the introduction of the Join-Accumulate Machine (JAM) chain to boost interoperability across blockchains and Web3 applications. Additionally, GoTyme, a digital bank in the Philippines, has begun offering crypto trading with Polkadot support to over 6.5 million users.
Bearish momentum persists despite short-term oscillator divergence
Momentum remains weak as both the daily MACD and ADX point to a persistent bearish bias, while RSI sits at 37.3, further suggesting oversold conditions. The Stochastic RSI and CCI also highlight oversold signals, though Bull/Bear Power (BBP) maintains a bearish outlook, indicating sellers dominate intraday activity. DOT opened slightly lower than the previous close (no significant gap) and is trading near the bottom of today's range, reflecting low intraday volatility and ongoing pressure after the open. Despite the daily loss of 1.96%, short-term oscillators show some divergence with HMA and Stoch RSI flashing buy signals, but these are overwhelmed by the broader bearish momentum.
Downside risk prevails as consolidation expected within tight band
Over the next five trading days, the expected price range for DOT is $1.95 to $2.45, which outlines a volatility band relative to current levels. The probability of a price increase is very low (less than 20%), while a further price decrease remains much more likely in the current setup. The baseline scenario anticipates DOT consolidating sideways within this narrow corridor. For a bullish outcome, DOT would need to decisively break above resistance near $2.25 – $2.30, potentially targeting the $2.40 area, while a failure of support at $2.05 – $1.95 could see the asset move below $2.00.
Previously it was reported that Polkadot continued to face persistent bearish pressure, trading below all key moving averages and showing weak momentum with bearish MACD and ADX readings. Support was identified near recent lows while dynamic resistance and oversold signals limited the likelihood of a sustained upward breakout, keeping consolidation likely within the $2.00–$2.47 volatility band barring a significant catalyst.


Latest Polkadot News


-
 Afghanistan
-
 Albania
-
 Algeria
-
 Angola
-
 Argentina
-
 Armenia
-
 Australia
-
 Austria
-
 Azerbaijan
-
 Bahamas
-
 Bahrain
-
 Bangladesh
-
 Belarus
-
 Belgium
-
 Bolivia
-
 Botswana
-
 Brazil
-
 Brunei
-
 Bulgaria
-
 Cambodia
-
 Cameroon
-
 Canada
-
 Chile
Chile
-
 China
China
-
 Colombia
-
 Congo
Congo
-
 Costa Rica
-
 Cote d'Ivoire
-
 Croatia
-
 Cuba
Cuba
-
 Cyprus
-
 Czechia
-
 DR Congo
-
 Denmark
-
 Dominican Republic
-
 Ecuador
-
 Egypt
Egypt
-
 El Salvador
-
 Estonia
-
 Eswatini
-
 Ethiopia
-
 Finland
-
 France
-
 Georgia
-
 Germany
-
 Ghana
Ghana
-
 Greece
-
 Haiti
Haiti
-
 Hong Kong
-
 Hungary
-
 India
India
-
 Indonesia
-
 Iran, Islamic republic
-
 Iraq
Iraq
-
 Ireland
-
 Israel
-
 Italy
Italy
-
 Jamaica
-
 Japan
Japan
-
 Jordan
-
 Kazakhstan
-
 Kenya
Kenya
-
 Korea
Korea
-
 Kuwait
-
 Kyrgyzstan
-
 Laos
Laos
-
 Latvia
-
 Lebanon
-
 Lesotho
-
 Libya
Libya
-
 Lithuania
-
 Luxembourg
-
 Madagascar
-
 Malaysia
-
 Malta
Malta
-
 Mauritius
-
 Mexico
-
 Moldova
-
 Mongolia
-
 Montenegro
-
 Morocco
-
 Mozambique
-
 Myanmar
-
 Namibia
-
 Nepal
Nepal
-
 Netherlands
-
 New Zealand
-
 Nigeria
-
 North Macedonia
-
 Norway
-
 Oman
Oman
-
 Pakistan
-
 Palestine
-
 Panama
-
 Papua New Guinea
-
 Paraguay
-
 Peru
Peru
-
 Philippines
-
 Poland
-
 Portugal
-
 Puerto Rico
-
 Qatar
Qatar
-
 Reunion
-
 Romania
-
 Rwanda
-
 Saudi Arabia
-
 Serbia
-
 Singapore
-
 Slovakia
-
 Slovenia
-
 Somalia
-
 South Africa
-
 Spain
Spain
-
 Sri Lanka
-
 Sweden
-
 Switzerland
-
 Syria
Syria
-
 Taiwan
-
 Tajikistan
-
 Tanzania
-
 Thailand
-
 Trinidad and Tobago
-
 Tunisia
-
 Turkey
-
 UAE
UAE
-
 Uganda
-
 Ukraine
-
 United Kingdom
-
United States
-
 Uruguay
-
 Uzbekistan
-
 Venezuela
-
 Vietnam
-
 Yemen
Yemen
-
 Zambia
-
 Zimbabwe
- Forex
- Crypto
