
Binance Coin price prediction: Downside risk dominates? BNB stabilizes near $843

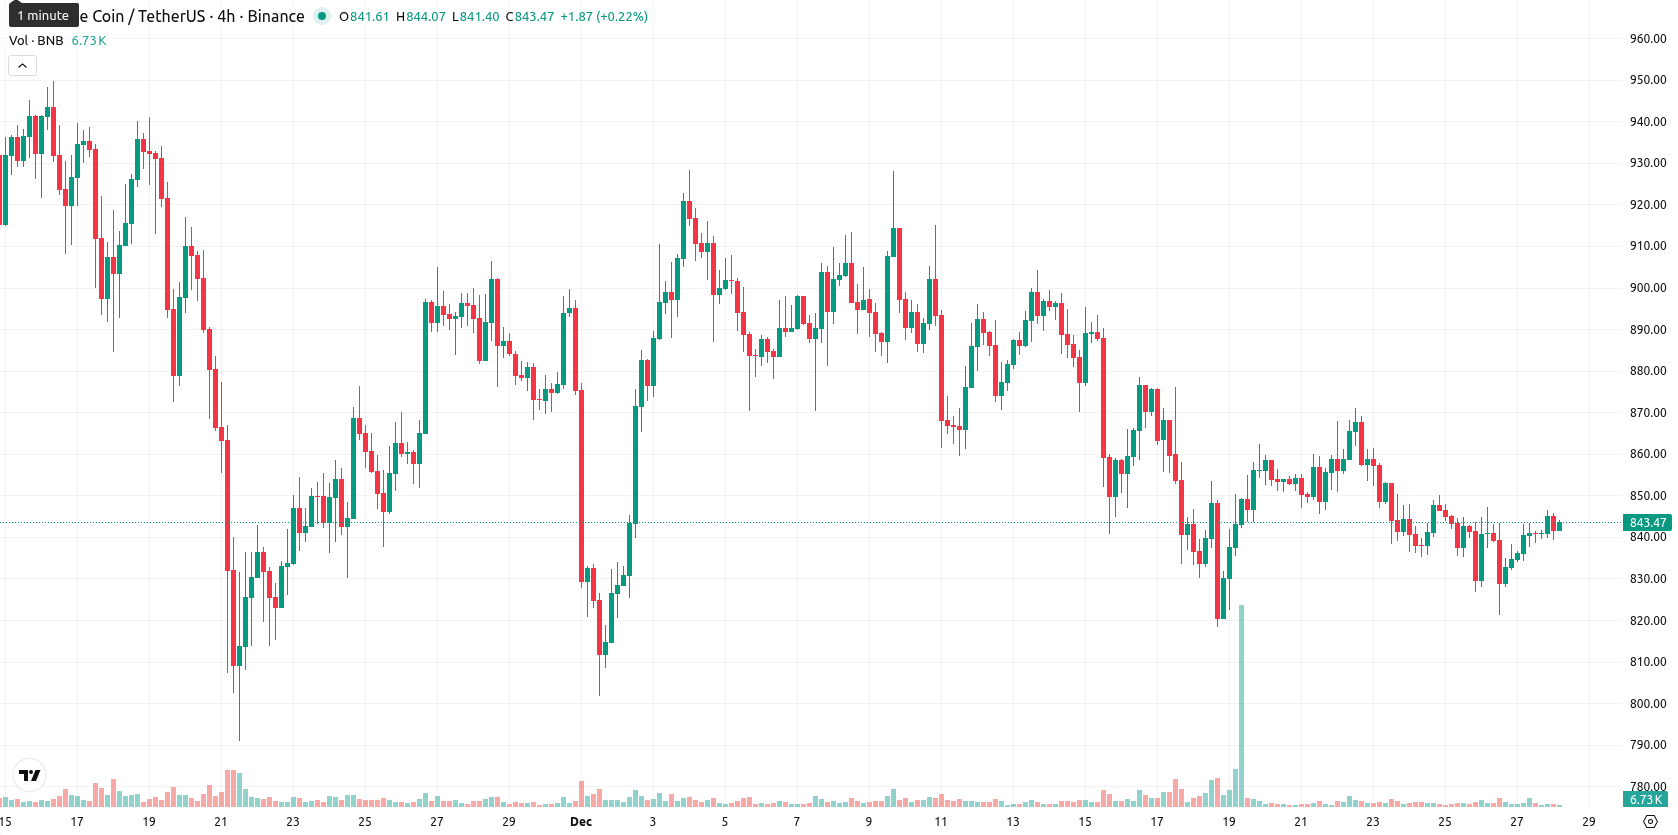
Binance Coin (BNB) is trading at $843.10, marking a modest daily gain of 0.70%. The price remains under pressure, positioned below its MA-20 ($863.20), MA-50 ($886.20), and MA-200 ($880.40), indicating persistent bearish sentiment across all main trend timeframes.
Highlights
- BNB is trading at $843.10, below the MA-20 ($863.20), MA-50 ($886.20), and MA-200 ($880.40), signaling sustained downward pressure across key timeframes.
- Momentum indicators are mixed: MACD and ADX confirm bearish sentiment, RSI is below 43, and Bull/Bear Power stands at an oversold –4.7, indicating persistent seller dominance.
- BNB is expected to trade sideways between $830 and $870 over the next five days, with less than 20% probability of a renewed upward move above $873.
Downside momentum intensifies as oscillators stay mixed
Technical signals for BNB are mixed: while the asset remains compressed below key moving averages, nearest resistance stands at the Ichimoku Kijun level of $873.30, with immediate support around the recent daily range lows. Momentum indicators paint a bearish picture as both MACD and ADX lean negative, while oscillators are oversold or neutral — the RSI is just below 43, CCI is negative, and the Bull/Bear Power (BBP) is firmly oversold at –4.7. The Stochastic RSI is slightly overbought, but overall momentum and oscillators are not aligned. Price action sits near the middle of today's range, and daily volatility is moderate.
Sideways bias favored as breakout risk remains limited
Over the next five trading days, BNB is likely to fluctuate within a $808 to $880 volatility band relative to current levels. The likelihood of a renewed bullish breakout above $873 is low (less than 20%), so further downside toward $808 is the more probable outcome if support at $830 fails. The baseline scenario expects sideways movement between $830 and $870 while technical signals remain mixed. A clear shift in momentum or a breakout beyond these bands is required for directional conviction.
Last time, analysts noted that Binance Coin (BNB) is trading below key moving averages, with daily momentum indicators such as MACD and RSI reinforcing a bearish trend and signaling mild oversold conditions. Immediate resistance is identified at the Ichimoku Kijun level of $865, while support is forming just below the current price, and BNB is expected to oscillate within a narrow range unless a breakout occurs.


-
 Afghanistan
-
 Albania
-
 Algeria
-
 Angola
-
 Argentina
-
 Armenia
-
 Australia
-
 Austria
-
 Azerbaijan
-
 Bahamas
-
 Bahrain
-
 Bangladesh
-
 Belarus
-
 Belgium
-
 Bolivia
-
 Botswana
-
 Brazil
-
 Brunei
-
 Bulgaria
-
 Cambodia
-
 Cameroon
-
 Canada
-
 Chile
Chile
-
 China
China
-
 Colombia
-
 Congo
Congo
-
 Costa Rica
-
 Cote d'Ivoire
-
 Croatia
-
 Cuba
Cuba
-
 Cyprus
-
 Czechia
-
 DR Congo
-
 Denmark
-
 Dominican Republic
-
 Ecuador
-
 Egypt
Egypt
-
 El Salvador
-
 Estonia
-
 Eswatini
-
 Ethiopia
-
 Finland
-
 France
-
 Georgia
-
 Germany
-
 Ghana
Ghana
-
 Greece
-
 Haiti
Haiti
-
 Hong Kong
-
 Hungary
-
 India
India
-
 Indonesia
-
 Iran, Islamic republic
-
 Iraq
Iraq
-
 Ireland
-
 Israel
-
 Italy
Italy
-
 Jamaica
-
 Japan
Japan
-
 Jordan
-
 Kazakhstan
-
 Kenya
Kenya
-
 Korea
Korea
-
 Kuwait
-
 Kyrgyzstan
-
 Laos
Laos
-
 Latvia
-
 Lebanon
-
 Lesotho
-
 Libya
Libya
-
 Lithuania
-
 Luxembourg
-
 Madagascar
-
 Malaysia
-
 Malta
Malta
-
 Mauritius
-
 Mexico
-
 Moldova
-
 Mongolia
-
 Montenegro
-
 Morocco
-
 Mozambique
-
 Myanmar
-
 Namibia
-
 Nepal
Nepal
-
 Netherlands
-
 New Zealand
-
 Nigeria
-
 North Macedonia
-
 Norway
-
 Oman
Oman
-
 Pakistan
-
 Palestine
-
 Panama
-
 Papua New Guinea
-
 Paraguay
-
 Peru
Peru
-
 Philippines
-
 Poland
-
 Portugal
-
 Puerto Rico
-
 Qatar
Qatar
-
 Reunion
-
 Romania
-
 Rwanda
-
 Saudi Arabia
-
 Serbia
-
 Singapore
-
 Slovakia
-
 Slovenia
-
 Somalia
-
 South Africa
-
 Spain
Spain
-
 Sri Lanka
-
 Sweden
-
 Switzerland
-
 Syria
Syria
-
 Taiwan
-
 Tajikistan
-
 Tanzania
-
 Thailand
-
 Trinidad and Tobago
-
 Tunisia
-
 Turkey
-
 UAE
UAE
-
 Uganda
-
 Ukraine
-
 United Kingdom
-
United States
-
 Uruguay
-
 Uzbekistan
-
 Venezuela
-
 Vietnam
-
 Yemen
Yemen
-
 Zambia
-
 Zimbabwe
- Forex
- Crypto
