
Ethereum price prediction: ETH ends 2025 down 11% after fourth monthly loss

Ethereum price is trading just below $3,000 on the first day of 2026, trapped in a tight consolidation zone that has lasted more than 10 days. This smaller range, stretching from $2,900 to $3,080, reflects the subdued activity and portfolio balancing efforts of investors heading into the new year. Volume has been declining during this phase, further confirming the market's indecision following an extended downtrend.
Highlights
- Ethereum trades inside triangle pattern as long bias grows near $3,000 zone.
- ETH ends 2025 down 11% despite pro-crypto U.S. administration and Fed rate cuts.
- Price compression between $2,900 and $3,080 sets up early 2026 breakout direction.
That broader downtrend began from the $4,960 all time high reached in August 2025. Ethereum then ended 2025 down by more than 11% for the year, closing December below the $3,000 psychological level as the fourth consecutive monthly loss. This persistent bearish momentum came despite several supportive catalysts throughout the year including a political shift in the United States that favoured crypto adoption and three rate cuts of 25 basis points each from the U.S. Federal Reserve.
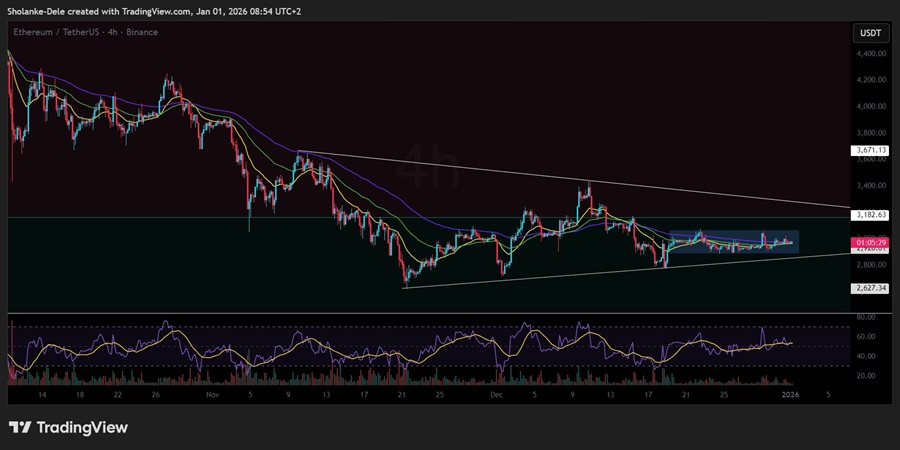
Ethereum price dynamics (July - Dec 2025). Source: TradingView
Since November, however, Ethereum has shown a series of higher lows, supported by a visible rising trendline on the daily chart. But these higher lows have not been matched by higher highs. A descending trendline has continued to connect lower highs, creating a converging triangle pattern on the daily timeframe. This technical formation hints that a directional breakout may be brewing.
ETH open interest stabilises near $18B as price compresses in triangle pattern
Importantly, the upper boundary of the triangle is being reinforced by the 100-day EMA, adding a layer of resistance near the top of the pattern. Price is also trading below both the 50 and 100 EMA levels on the daily and weekly charts, which aligns the longer-term structure to the downside. Yet the current consolidation above $2,900 keeps the short-term outlook open to both scenarios.
On the derivatives side, open interest on Ethereum contracts declined throughout the broader downtrend. But in recent weeks, as price compressed into the triangle, open interest has stabilised around $18 billion. Meanwhile, the long-to-short ratio has increased sharply from 1.85 to 3.0, pointing to growing bullish conviction despite the technical stalemate.
The longer Ethereum stays within this converging triangle, the more pressure builds for a breakout. A move beyond either boundary of the $2,900 to $3,080 range may also serve as a trigger for a larger move out of the triangle pattern, setting the directional tone for the first quarter of 2026.
In recent analysis, we discussed how institutional inflows into Ethereum rose as staking surged and network upgrades launched. Spot ETF allocations and the Pectra hard fork boosted scalability, staking, and institutional confidence.


Latest Ethereum News


-
 Afghanistan
-
 Albania
-
 Algeria
-
 Angola
-
 Argentina
-
 Armenia
-
 Australia
-
 Austria
-
 Azerbaijan
-
 Bahamas
-
 Bahrain
-
 Bangladesh
-
 Belarus
-
 Belgium
-
 Bolivia
-
 Botswana
-
 Brazil
-
 Brunei
-
 Bulgaria
-
 Cambodia
-
 Cameroon
-
 Canada
-
 Chile
Chile
-
 China
China
-
 Colombia
-
 Congo
Congo
-
 Costa Rica
-
 Cote d'Ivoire
-
 Croatia
-
 Cuba
Cuba
-
 Cyprus
-
 Czechia
-
 DR Congo
-
 Denmark
-
 Dominican Republic
-
 Ecuador
-
 Egypt
Egypt
-
 El Salvador
-
 Estonia
-
 Eswatini
-
 Ethiopia
-
 Finland
-
 France
-
 Georgia
-
 Germany
-
 Ghana
Ghana
-
 Greece
-
 Haiti
Haiti
-
 Hong Kong
-
 Hungary
-
 India
India
-
 Indonesia
-
 Iran, Islamic republic
-
 Iraq
Iraq
-
 Ireland
-
 Israel
-
 Italy
Italy
-
 Jamaica
-
 Japan
Japan
-
 Jordan
-
 Kazakhstan
-
 Kenya
Kenya
-
 Korea
Korea
-
 Kuwait
-
 Kyrgyzstan
-
 Laos
Laos
-
 Latvia
-
 Lebanon
-
 Lesotho
-
 Libya
Libya
-
 Lithuania
-
 Luxembourg
-
 Madagascar
-
 Malaysia
-
 Malta
Malta
-
 Mauritius
-
 Mexico
-
 Moldova
-
 Mongolia
-
 Montenegro
-
 Morocco
-
 Mozambique
-
 Myanmar
-
 Namibia
-
 Nepal
Nepal
-
 Netherlands
-
 New Zealand
-
 Nigeria
-
 North Macedonia
-
 Norway
-
 Oman
Oman
-
 Pakistan
-
 Palestine
-
 Panama
-
 Papua New Guinea
-
 Paraguay
-
 Peru
Peru
-
 Philippines
-
 Poland
-
 Portugal
-
 Puerto Rico
-
 Qatar
Qatar
-
 Reunion
-
 Romania
-
 Rwanda
-
 Saudi Arabia
-
 Serbia
-
 Singapore
-
 Slovakia
-
 Slovenia
-
 Somalia
-
 South Africa
-
 Spain
Spain
-
 Sri Lanka
-
 Sweden
-
 Switzerland
-
 Syria
Syria
-
 Taiwan
-
 Tajikistan
-
 Tanzania
-
 Thailand
-
 Trinidad and Tobago
-
 Tunisia
-
 Turkey
-
 UAE
UAE
-
 Uganda
-
 Ukraine
-
 United Kingdom
-
United States
-
 Uruguay
-
 Uzbekistan
-
 Venezuela
-
 Vietnam
-
 Yemen
Yemen
-
 Zambia
-
 Zimbabwe
- Forex
- Crypto
