
Kaia: Overbought conditions trigger a 7.37% climb amid volatile trading

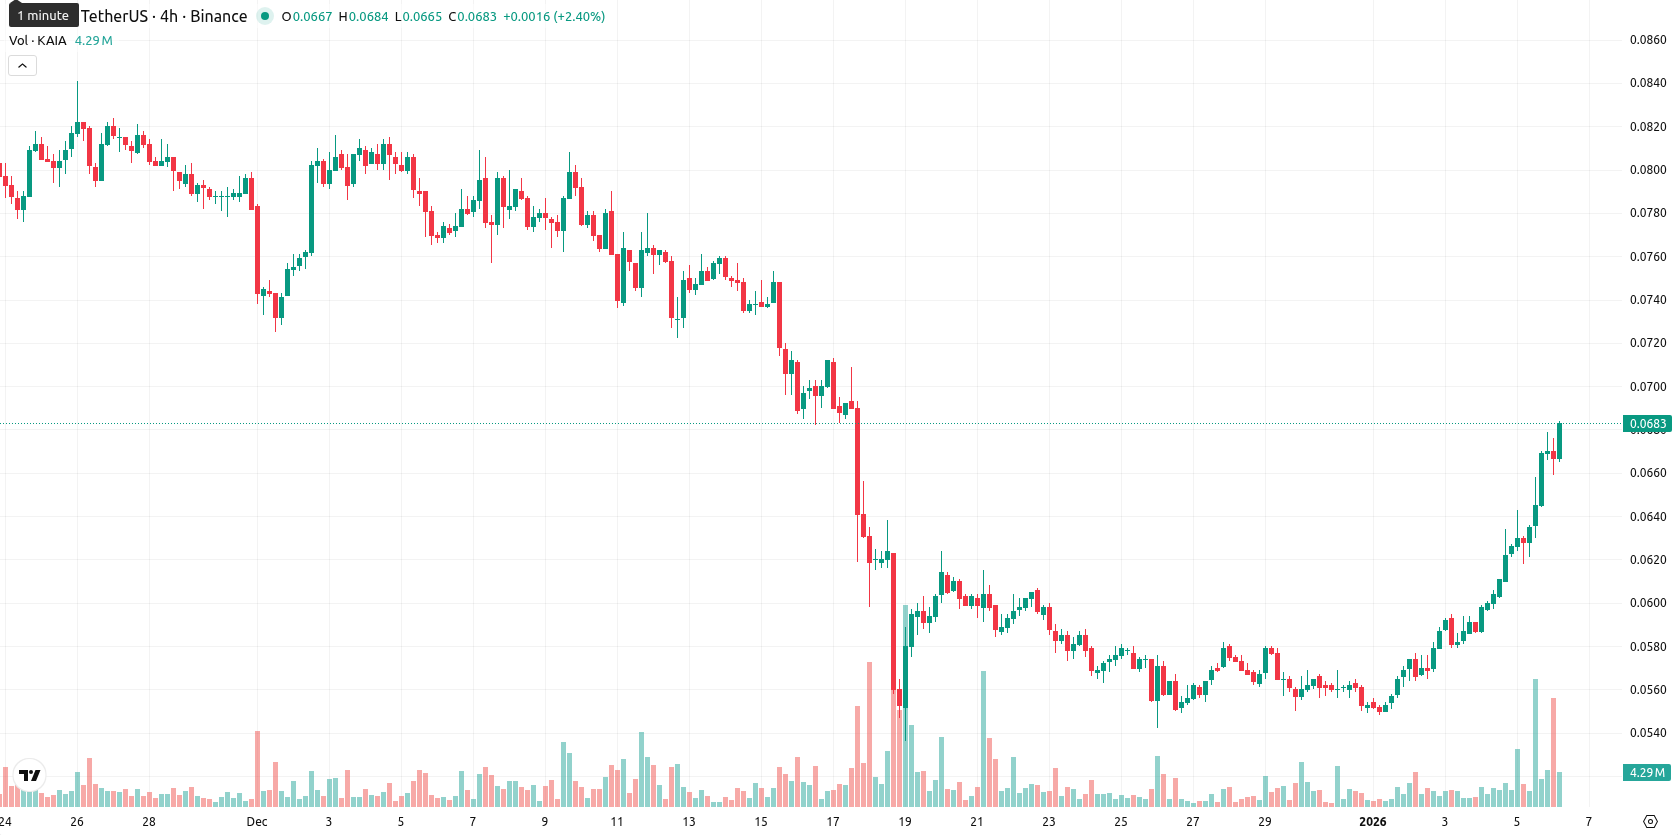
Kaia (KAIA) is trading at $0.067, which is above the MA-20 ($0.0586) but below both the MA-50 ($0.0705) and the MA-200 ($0.1249). This positioning signals short-term bullish momentum, though there is ongoing medium- and long-term seller pressure as the price remains capped by higher moving averages.
Highlights
- KAIA trades at $0.067, above MA-20 ($0.0586) but below MA-50 ($0.0705) and MA-200 ($0.1249), signaling ongoing medium- and long-term selling pressure.
- Momentum indicators are mixed, with MACD and ADX signaling sell, RSI at 57 indicating slight buyer edge, and overbought oscillators warning of cautious buyer dominance intraday.
- Forecast for the next 5 trading days expects consolidation between $0.0659 and $0.0666, with probability of price increase below 20 percent.
Bearish technical bias as overbought signals limit upside
Momentum indicators on the daily chart present mixed signals. The MACD and ADX both indicate a bearish bias, suggesting weak follow-through on the upside, while an RSI of 57 shows that buyers maintain a slight advantage. Oscillators such as the Stoch RSI and CCI point toward overbought conditions, and although Bull/Bear Power remains positive, it is relatively weak. The Kijun (Ichimoku) level at $0.0655 provides immediate support, with resistance forming near the MA-50 at $0.0705.
Downside risk rises as sideways action dominates outlook
Over the next five trading days, KAIA is likely to consolidate within the typical volatility band between $0.0659 and $0.0666. Given current technical conditions, the probability of upward movement is low (less than 20%), and a downward move is more likely. Baseline expectation is sideways movement; a bullish break above $0.0705 could increase buying interest, whereas a decisive drop below $0.0655 would likely lead to greater selling pressure.
Previously it was reported that Kaia is exhibiting short-term bullish momentum, trading above its 20-day moving average, though it faces resistance near its 50-day average and key technical levels, with medium- and long-term trends remaining bearish. Despite strong intraday gains and heightened trend strength indicated by the ADX, mixed momentum signals and elevated volatility suggest the price is likely to stay range-bound unless resistance levels above $0.0666 are convincingly broken.


-
 Afghanistan
-
 Albania
-
 Algeria
-
 Angola
-
 Argentina
-
 Armenia
-
 Australia
-
 Austria
-
 Azerbaijan
-
 Bahamas
-
 Bahrain
-
 Bangladesh
-
 Belarus
-
 Belgium
-
 Bolivia
-
 Botswana
-
 Brazil
-
 Brunei
-
 Bulgaria
-
 Cambodia
-
 Cameroon
-
 Canada
-
 Chile
Chile
-
 China
China
-
 Colombia
-
 Congo
Congo
-
 Costa Rica
-
 Cote d'Ivoire
-
 Croatia
-
 Cuba
Cuba
-
 Cyprus
-
 Czechia
-
 DR Congo
-
 Denmark
-
 Dominican Republic
-
 Ecuador
-
 Egypt
Egypt
-
 El Salvador
-
 Estonia
-
 Eswatini
-
 Ethiopia
-
 Finland
-
 France
-
 Georgia
-
 Germany
-
 Ghana
Ghana
-
 Greece
-
 Haiti
Haiti
-
 Hong Kong
-
 Hungary
-
 India
India
-
 Indonesia
-
 Iran, Islamic republic
-
 Iraq
Iraq
-
 Ireland
-
 Israel
-
 Italy
Italy
-
 Jamaica
-
 Japan
Japan
-
 Jordan
-
 Kazakhstan
-
 Kenya
Kenya
-
 Korea
Korea
-
 Kuwait
-
 Kyrgyzstan
-
 Laos
Laos
-
 Latvia
-
 Lebanon
-
 Lesotho
-
 Libya
Libya
-
 Lithuania
-
 Luxembourg
-
 Madagascar
-
 Malaysia
-
 Malta
Malta
-
 Mauritius
-
 Mexico
-
 Moldova
-
 Mongolia
-
 Montenegro
-
 Morocco
-
 Mozambique
-
 Myanmar
-
 Namibia
-
 Nepal
Nepal
-
 Netherlands
-
 New Zealand
-
 Nigeria
-
 North Macedonia
-
 Norway
-
 Oman
Oman
-
 Pakistan
-
 Palestine
-
 Panama
-
 Papua New Guinea
-
 Paraguay
-
 Peru
Peru
-
 Philippines
-
 Poland
-
 Portugal
-
 Puerto Rico
-
 Qatar
Qatar
-
 Reunion
-
 Romania
-
 Rwanda
-
 Saudi Arabia
-
 Serbia
-
 Singapore
-
 Slovakia
-
 Slovenia
-
 Somalia
-
 South Africa
-
 Spain
Spain
-
 Sri Lanka
-
 Sweden
-
 Switzerland
-
 Syria
Syria
-
 Taiwan
-
 Tajikistan
-
 Tanzania
-
 Thailand
-
 Trinidad and Tobago
-
 Tunisia
-
 Turkey
-
 UAE
UAE
-
 Uganda
-
 Ukraine
-
 United Kingdom
-
United States
-
 Uruguay
-
 Uzbekistan
-
 Venezuela
-
 Vietnam
-
 Yemen
Yemen
-
 Zambia
-
 Zimbabwe
- Forex
- Crypto
