
Polkadot eases after capping token supply and ahead of network upgrade

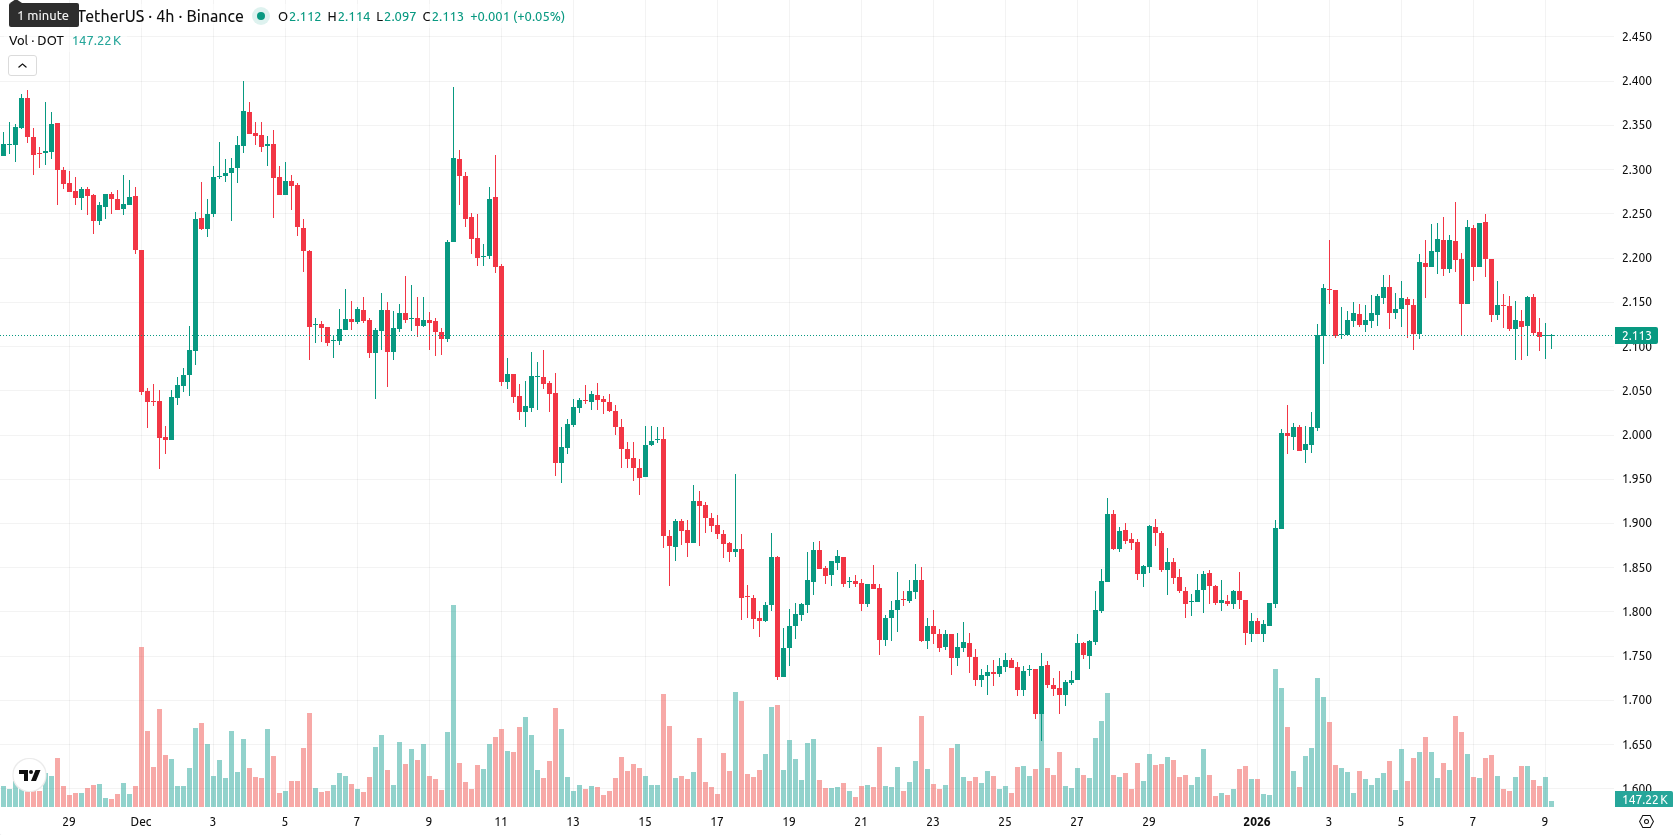
Polkadot (DOT) is trading at $2.113 after a daily retreat of 0.28%, positioning itself above the MA-20 ($1.933) and MA-50 ($2.067), while remaining notably below the MA-200 ($3.272). This setup reflects constructive short- and medium-term trends, but points to a continued bearish environment over the longer term.
Highlights
- Polkadot has permanently capped its DOT token supply at 2.1 billion, ending its inflationary issuance model and fundamentally reshaping its tokenomics.
- Institutional interest in Polkadot has increased following the supply cap adjustment, signaling heightened attention from professional investors.
- A network upgrade scheduled for January 20 will improve execution latency and developer compatibility by integrating updates tested on the Kusama parachain.
Supply cap and network upgrade fuel institutional activity and protocol focus
Polkadot has permanently capped its DOT token supply at 2.1 billion, transitioning away from its previous inflationary issuance model and resulting in a pivotal change for its tokenomics. Institutional interest has increased alongside this adjustment, while a scheduled January 20 network upgrade aims to improve execution latency and developer compatibility by integrating updates tested on its Kusama parachain. The protocol also continues to develop interoperability, staking, governance, and support for decentralized finance and enterprise blockchain initiatives.
Mixed daily momentum amid key support, resistance, and muted volatility
From a technical perspective, the closest dynamic support is provided by the Ichimoku Kijun at $1.958, with overhead resistance marked at the MA-50 ($2.067) and the psychological level at $2.20. Daily momentum signals are mixed: MACD and ADX on the daily chart suggest moderate bullish momentum, while RSI and Bull/Bear Power indicate mild buying interest. Overbought and oversold readings are largely neutral on the Stochastic RSI and modestly positive on CCI and the daily RSI, pointing to balanced short-term conditions. The price action is tepid, with volatility low and the session trading near the midpoint of its daily range, as short-term positive signals contrast with lingering bearish sentiment on the weekly chart.
Range-bound forecast as breakout risk remains limited
Over the next five trading days, DOT is expected to fluctuate within a typical volatility band between $2.08 and $2.12. Current levels sit near the center of this anticipated trading corridor, with a less than 20% likelihood of upside breakout. The base case anticipates range-bound movement, with $2.08 as immediate support and $2.12 as resistance. A sustained move above $2.12 could propel a retest of the $2.20 area, while a drop below $2.08 may expose the $1.96 level to renewed downside pressure.
Previously it was reported that Polkadot is exhibiting short- and medium-term bullish momentum, supported by trading above its 20- and 50-day moving averages but remains under long-term downward pressure below the 200-day average. Technical indicators show mixed momentum with the RSI modestly bullish, MACD neutral, and overbought signals present, while support lies near $1.96 and resistance is seen near $2.18–$2.20, suggesting a higher likelihood of sideways or mildly bearish price action in the near term.


Latest Polkadot News


-
 Afghanistan
-
 Albania
-
 Algeria
-
 Angola
-
 Argentina
-
 Armenia
-
 Australia
-
 Austria
-
 Azerbaijan
-
 Bahamas
-
 Bahrain
-
 Bangladesh
-
 Belarus
-
 Belgium
-
 Bolivia
-
 Botswana
-
 Brazil
-
 Brunei
-
 Bulgaria
-
 Cambodia
-
 Cameroon
-
 Canada
-
 Chile
Chile
-
 China
China
-
 Colombia
-
 Congo
Congo
-
 Costa Rica
-
 Cote d'Ivoire
-
 Croatia
-
 Cuba
Cuba
-
 Cyprus
-
 Czechia
-
 DR Congo
-
 Denmark
-
 Dominican Republic
-
 Ecuador
-
 Egypt
Egypt
-
 El Salvador
-
 Estonia
-
 Eswatini
-
 Ethiopia
-
 Finland
-
 France
-
 Georgia
-
 Germany
-
 Ghana
Ghana
-
 Greece
-
 Haiti
Haiti
-
 Hong Kong
-
 Hungary
-
 India
India
-
 Indonesia
-
 Iran, Islamic republic
-
 Iraq
Iraq
-
 Ireland
-
 Israel
-
 Italy
Italy
-
 Jamaica
-
 Japan
Japan
-
 Jordan
-
 Kazakhstan
-
 Kenya
Kenya
-
 Korea
Korea
-
 Kuwait
-
 Kyrgyzstan
-
 Laos
Laos
-
 Latvia
-
 Lebanon
-
 Lesotho
-
 Libya
Libya
-
 Lithuania
-
 Luxembourg
-
 Madagascar
-
 Malaysia
-
 Malta
Malta
-
 Mauritius
-
 Mexico
-
 Moldova
-
 Mongolia
-
 Montenegro
-
 Morocco
-
 Mozambique
-
 Myanmar
-
 Namibia
-
 Nepal
Nepal
-
 Netherlands
-
 New Zealand
-
 Nigeria
-
 North Macedonia
-
 Norway
-
 Oman
Oman
-
 Pakistan
-
 Palestine
-
 Panama
-
 Papua New Guinea
-
 Paraguay
-
 Peru
Peru
-
 Philippines
-
 Poland
-
 Portugal
-
 Puerto Rico
-
 Qatar
Qatar
-
 Reunion
-
 Romania
-
 Rwanda
-
 Saudi Arabia
-
 Serbia
-
 Singapore
-
 Slovakia
-
 Slovenia
-
 Somalia
-
 South Africa
-
 Spain
Spain
-
 Sri Lanka
-
 Sweden
-
 Switzerland
-
 Syria
Syria
-
 Taiwan
-
 Tajikistan
-
 Tanzania
-
 Thailand
-
 Trinidad and Tobago
-
 Tunisia
-
 Turkey
-
 UAE
UAE
-
 Uganda
-
 Ukraine
-
 United Kingdom
-
United States
-
 Uruguay
-
 Uzbekistan
-
 Venezuela
-
 Vietnam
-
 Yemen
Yemen
-
 Zambia
-
 Zimbabwe
- Forex
- Crypto
