
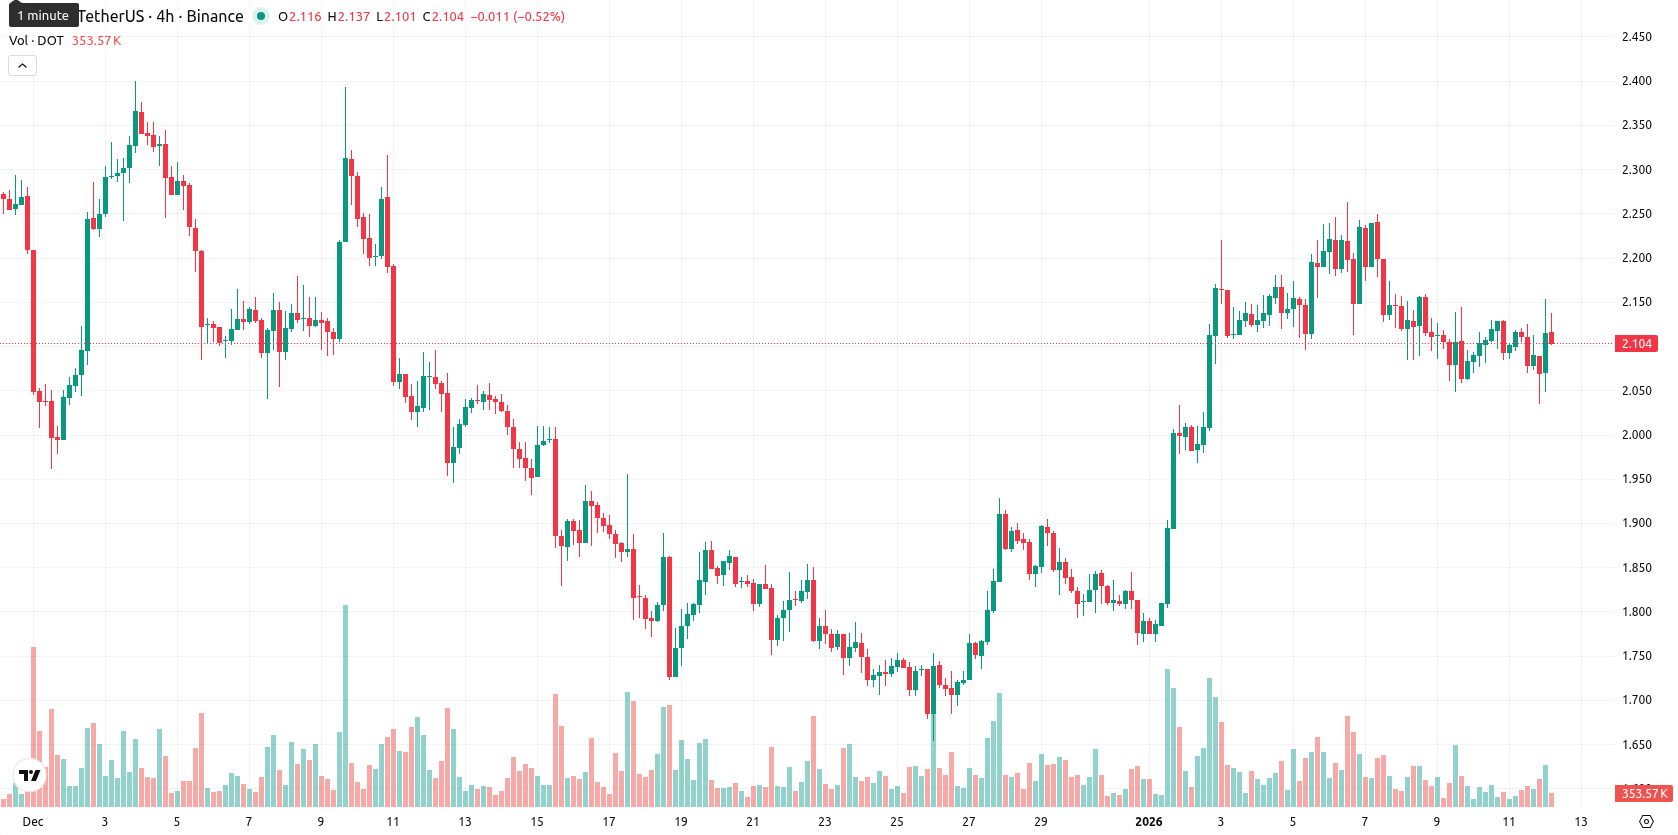
Polkadot: sideways price structure keeps DOT in tight range despite mild buy signals

Polkadot (DOT) is trading above both the MA-20 ($1.973) and MA-50 ($2.048) but well below the MA-200 ($3.252), indicating a short- to medium-term bullish structure within a continuing long-term downtrend.
Highlights
- DOT trades above MA-20 ($1.973) and MA-50 ($2.048) but remains below MA-200 ($3.252), confirming a short-to-medium term bullish bias within a longer bearish trend.
- Daily indicators are mixed: MACD flashes mild buy, ADX is weak at 23.6, while RSI at 51 and positive Bull/Bear Power indicate buyer strength but lack conviction.
- For the next 5 trading days, DOT is expected to fluctuate between $1.97 support and $2.29 resistance, with under 20% probability of a sustained price increase.
Mixed daily momentum as buyers test resistance and weak trend
Nearest dynamic support is seen around the Ichimoku Kijun at $1.958, while resistance comes in near the MA-50 at $2.048 and the next round level at $2.15. Momentum on the daily chart is mixed: the MACD signals a mild buy while ADX at 23.6 points to a weak trend. The RSI at 51 suggests a neutral-to-slightly bullish setup with no overbought or oversold condition, and Stochastic RSI and CCI confirm a neutral backdrop. Bull/Bear Power is positive, indicating intraday dominance by buyers, while the Awesome Oscillator is neutral and does not reinforce the current trend.
Mild downside risk as bearish indicators limit breakout potential
For the next 5 trading days, the expected normalized range is $1.97 to $2.29, keeping price moves within a typical volatility band relative to current levels. There is a very low probability (less than 20%) of a further sustained price increase, so a decrease is more likely given persistent weekly bearish signals from all major indicators. Baseline scenario: DOT fluctuates sideways between immediate support near $1.97 and resistance at $2.15 – $2.29. A bullish scenario would require a decisive move above $2.15, targeting the upper part of the range, while a bearish break below $1.97 could see accelerated losses toward the lower boundary.
Previously it was reported that Polkadot is exhibiting short-term strength, trading above key moving averages (MA-20 and MA-50), with constructive momentum signals (MACD, ADX) and intraday support but remaining below the longer-term MA-200, indicating lingering broader bearish pressure. Momentum oscillators show a mild bullish tilt but suggest limited volatility and a likely sideways range, with resistance near $2.11 and support at $1.96 until stronger directional signals emerge.


Latest Polkadot News


-
 Afghanistan
-
 Albania
-
 Algeria
-
 Angola
-
 Argentina
-
 Armenia
-
 Australia
-
 Austria
-
 Azerbaijan
-
 Bahamas
-
 Bahrain
-
 Bangladesh
-
 Belarus
-
 Belgium
-
 Bolivia
-
 Botswana
-
 Brazil
-
 Brunei
-
 Bulgaria
-
 Cambodia
-
 Cameroon
-
 Canada
-
 Chile
Chile
-
 China
China
-
 Colombia
-
 Congo
Congo
-
 Costa Rica
-
 Cote d'Ivoire
-
 Croatia
-
 Cuba
Cuba
-
 Cyprus
-
 Czechia
-
 DR Congo
-
 Denmark
-
 Dominican Republic
-
 Ecuador
-
 Egypt
Egypt
-
 El Salvador
-
 Estonia
-
 Eswatini
-
 Ethiopia
-
 Finland
-
 France
-
 Georgia
-
 Germany
-
 Ghana
Ghana
-
 Greece
-
 Haiti
Haiti
-
 Hong Kong
-
 Hungary
-
 India
India
-
 Indonesia
-
 Iran, Islamic republic
-
 Iraq
Iraq
-
 Ireland
-
 Israel
-
 Italy
Italy
-
 Jamaica
-
 Japan
Japan
-
 Jordan
-
 Kazakhstan
-
 Kenya
Kenya
-
 Korea
Korea
-
 Kuwait
-
 Kyrgyzstan
-
 Laos
Laos
-
 Latvia
-
 Lebanon
-
 Lesotho
-
 Libya
Libya
-
 Lithuania
-
 Luxembourg
-
 Madagascar
-
 Malaysia
-
 Malta
Malta
-
 Mauritius
-
 Mexico
-
 Moldova
-
 Mongolia
-
 Montenegro
-
 Morocco
-
 Mozambique
-
 Myanmar
-
 Namibia
-
 Nepal
Nepal
-
 Netherlands
-
 New Zealand
-
 Nigeria
-
 North Macedonia
-
 Norway
-
 Oman
Oman
-
 Pakistan
-
 Palestine
-
 Panama
-
 Papua New Guinea
-
 Paraguay
-
 Peru
Peru
-
 Philippines
-
 Poland
-
 Portugal
-
 Puerto Rico
-
 Qatar
Qatar
-
 Reunion
-
 Romania
-
 Rwanda
-
 Saudi Arabia
-
 Serbia
-
 Singapore
-
 Slovakia
-
 Slovenia
-
 Somalia
-
 South Africa
-
 Spain
Spain
-
 Sri Lanka
-
 Sweden
-
 Switzerland
-
 Syria
Syria
-
 Taiwan
-
 Tajikistan
-
 Tanzania
-
 Thailand
-
 Trinidad and Tobago
-
 Tunisia
-
 Turkey
-
 UAE
UAE
-
 Uganda
-
 Ukraine
-
 United Kingdom
-
United States
-
 Uruguay
-
 Uzbekistan
-
 Venezuela
-
 Vietnam
-
 Yemen
Yemen
-
 Zambia
-
 Zimbabwe
- Forex
- Crypto
