
Solana price holds near $133 as bearish structure keeps pressure intact

Solana is trading near the $131-$133 zone on January 20 after another sharp rejection, keeping the price pinned close to the lower end of its recent range. What stands out is not the size of the move, but the message it sends.
Highlights
- Solana trades near $131-$133 after another failed recovery.
- Price remains below key EMAs clustered near $137-$140.
- Flows and derivatives point to distribution, not accumulation.
The market has once again failed to sustain a recovery, and sellers have stepped back decisively after a brief attempt to stabilize earlier this month. The tone across SOL trading has shifted back to defensive. Price action no longer reflects basing behavior, but rather a continuation of corrective pressure following the November breakdown. The combination of weak structure and fading momentum is keeping downside risk active.
Daily structure confirms corrective trend remains intact
On the daily chart, Solana continues to trade firmly below all major EMAs, reinforcing the bearish bias that has dominated since late 2024. The 20-day EMA near $136.8 and the 50-day EMA around $137.7 are both sloping lower and have repeatedly capped bounce attempts over the past two weeks.
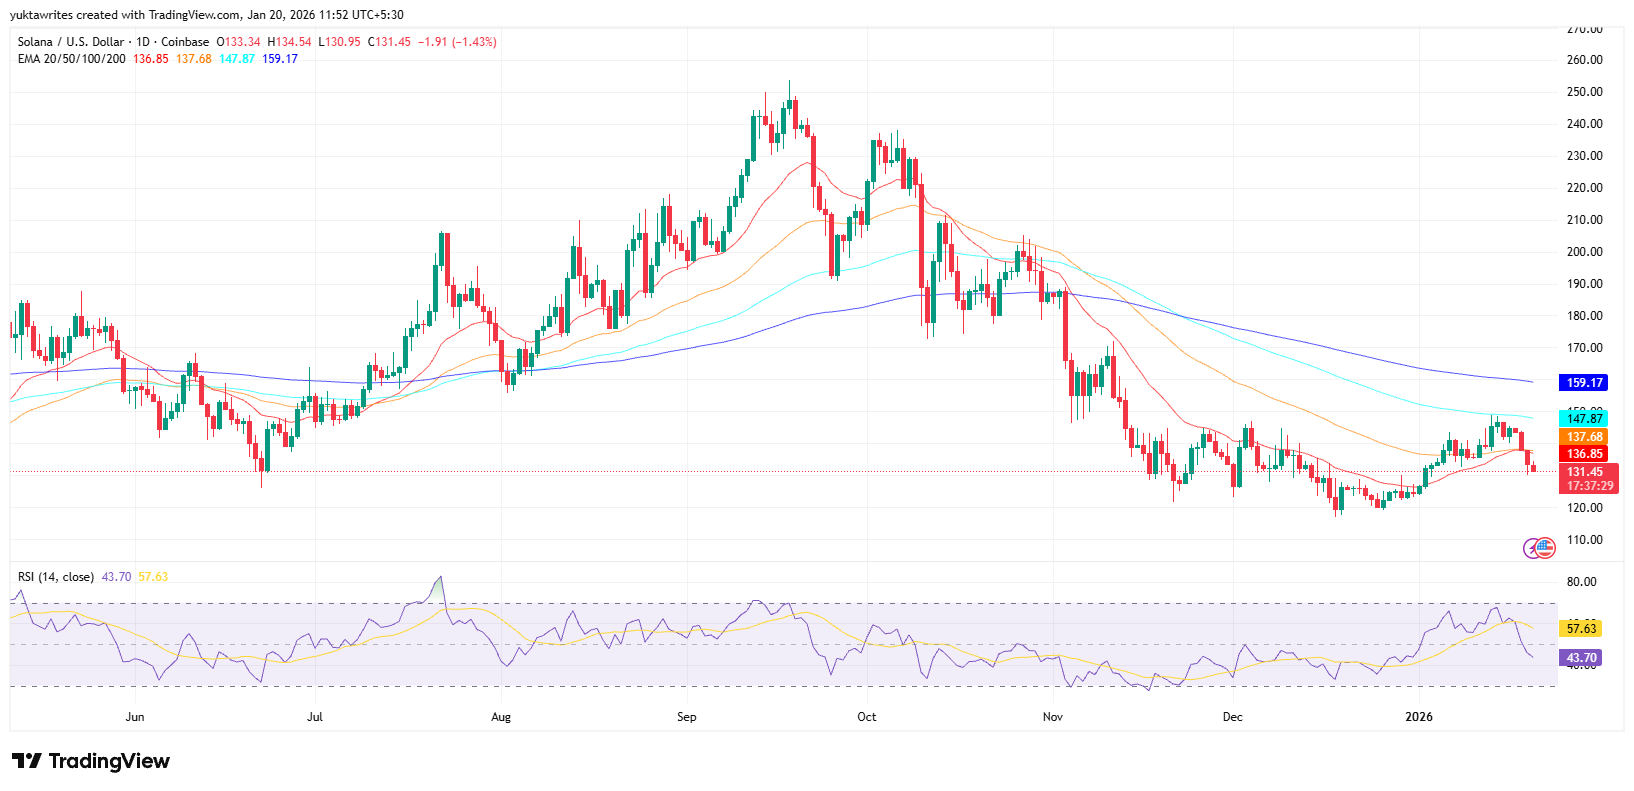
SOL price dynamics (Source: TradingView)
Above those levels, the 100-day EMA near $147.9 and the 200-day EMA around $159.2 underline the extent of technical damage done since the October peak. This stacked EMA structure confirms that the broader trend remains corrective rather than transitional. Each rally has attracted supply rather than follow-through buying, and price has struggled to reclaim even short-term resistance.
As long as SOL remains below the $136-$140 zone, upside attempts lack confirmation and should be treated as countertrend moves rather than the start of a recovery phase.
Momentum indicators reinforce this view. Daily RSI has slipped back into the low-40s after failing to hold above the neutral 50 level earlier this month. That loss of momentum signals fading buying pressure and limited conviction from dip buyers. Importantly, there is no clear bullish divergence forming on the higher timeframe, which keeps downside risk active if support weakens further.
Intraday action shows sellers controlling rebounds
Shorter-term structure offers little encouragement. On the 30-minute chart, Solana remains pinned below its Supertrend and Parabolic SAR levels following the sharp selloff earlier in the week. That impulsive move reset intraday structure lower, breaking local support and shifting control back to sellers.
Subsequent rebounds have been shallow and overlapping, with price consistently printing lower highs. This pattern suggests distribution rather than accumulation, with short-term traders using strength to exit positions rather than build new exposure. The lack of impulsive upside candles reinforces the idea that demand remains reactive, not proactive.
Near-term price action now reflects a tight consolidation near $130-$133, but without evidence of absorption or aggressive dip buying. Until higher highs form on lower timeframes, the intraday bias remains tilted toward selling rallies.
Flows and positioning underline fragile sentiment
Spot flow data aligns closely with the technical picture. Solana has seen persistent net outflows, indicating ongoing distribution by larger participants. Even during brief upside attempts, inflows have failed to expand meaningfully, suggesting that capital remains cautious and selective rather than committed.
Derivatives data adds another layer of caution. Open interest has edged lower alongside price, pointing to position unwinding rather than aggressive short buildup. This suggests the selloff is being driven more by risk reduction than panic. At the same time, long liquidations continue to dominate, showing that bullish positioning has been repeatedly flushed out during rallies.
Although long-to-short ratios remain elevated on some venues, that imbalance has not translated into price strength. Instead, it reflects fragile confidence among leveraged buyers who have yet to regain control of the tape.
Market outlook
From a forward-looking perspective, Solana remains technically vulnerable. As long as price trades below the $136-$140 resistance band, upside attempts are likely to fade. A clean daily close above that zone would be the first signal that selling pressure is easing and could open the door to a recovery toward $148.
On the downside, $130 is acting as near-term support. A sustained break below that level would expose the market to a deeper slide toward the mid-$120s, where the next meaningful demand zone sits.
For now, Solana remains firmly in a sell-the-rally environment. Momentum is weak, structure is damaged, and flows do not yet support a sustained recovery. Until price proves it can reclaim key resistance with conviction, patience continues to favor the bears.
Previously, we noted that Solana’s early-January rebound lacked volume and structural confirmation. The current rejection validates that assessment. The market has not transitioned into a basing phase, and the burden of proof remains firmly on buyers.


-
 Afghanistan
-
 Albania
-
 Algeria
-
 Angola
-
 Argentina
-
 Armenia
-
 Australia
-
 Austria
-
 Azerbaijan
-
 Bahamas
-
 Bahrain
-
 Bangladesh
-
 Belarus
-
 Belgium
-
 Bolivia
-
 Botswana
-
 Brazil
-
 Brunei
-
 Bulgaria
-
 Cambodia
-
 Cameroon
-
 Canada
-
 Chile
Chile
-
 China
China
-
 Colombia
-
 Congo
Congo
-
 Costa Rica
-
 Cote d'Ivoire
-
 Croatia
-
 Cuba
Cuba
-
 Cyprus
-
 Czechia
-
 DR Congo
-
 Denmark
-
 Dominican Republic
-
 Ecuador
-
 Egypt
Egypt
-
 El Salvador
-
 Estonia
-
 Eswatini
-
 Ethiopia
-
 Finland
-
 France
-
 Georgia
-
 Germany
-
 Ghana
Ghana
-
 Greece
-
 Haiti
Haiti
-
 Hong Kong
-
 Hungary
-
 India
India
-
 Indonesia
-
 Iran, Islamic republic
-
 Iraq
Iraq
-
 Ireland
-
 Israel
-
 Italy
Italy
-
 Jamaica
-
 Japan
Japan
-
 Jordan
-
 Kazakhstan
-
 Kenya
Kenya
-
 Korea
Korea
-
 Kuwait
-
 Kyrgyzstan
-
 Laos
Laos
-
 Latvia
-
 Lebanon
-
 Lesotho
-
 Libya
Libya
-
 Lithuania
-
 Luxembourg
-
 Madagascar
-
 Malaysia
-
 Malta
Malta
-
 Mauritius
-
 Mexico
-
 Moldova
-
 Mongolia
-
 Montenegro
-
 Morocco
-
 Mozambique
-
 Myanmar
-
 Namibia
-
 Nepal
Nepal
-
 Netherlands
-
 New Zealand
-
 Nigeria
-
 North Macedonia
-
 Norway
-
 Oman
Oman
-
 Pakistan
-
 Palestine
-
 Panama
-
 Papua New Guinea
-
 Paraguay
-
 Peru
Peru
-
 Philippines
-
 Poland
-
 Portugal
-
 Puerto Rico
-
 Qatar
Qatar
-
 Reunion
-
 Romania
-
 Rwanda
-
 Saudi Arabia
-
 Serbia
-
 Singapore
-
 Slovakia
-
 Slovenia
-
 Somalia
-
 South Africa
-
 Spain
Spain
-
 Sri Lanka
-
 Sweden
-
 Switzerland
-
 Syria
Syria
-
 Taiwan
-
 Tajikistan
-
 Tanzania
-
 Thailand
-
 Trinidad and Tobago
-
 Tunisia
-
 Turkey
-
 UAE
UAE
-
 Uganda
-
 Ukraine
-
 United Kingdom
-
United States
-
 Uruguay
-
 Uzbekistan
-
 Venezuela
-
 Vietnam
-
 Yemen
Yemen
-
 Zambia
-
 Zimbabwe
- Forex
- Crypto
