
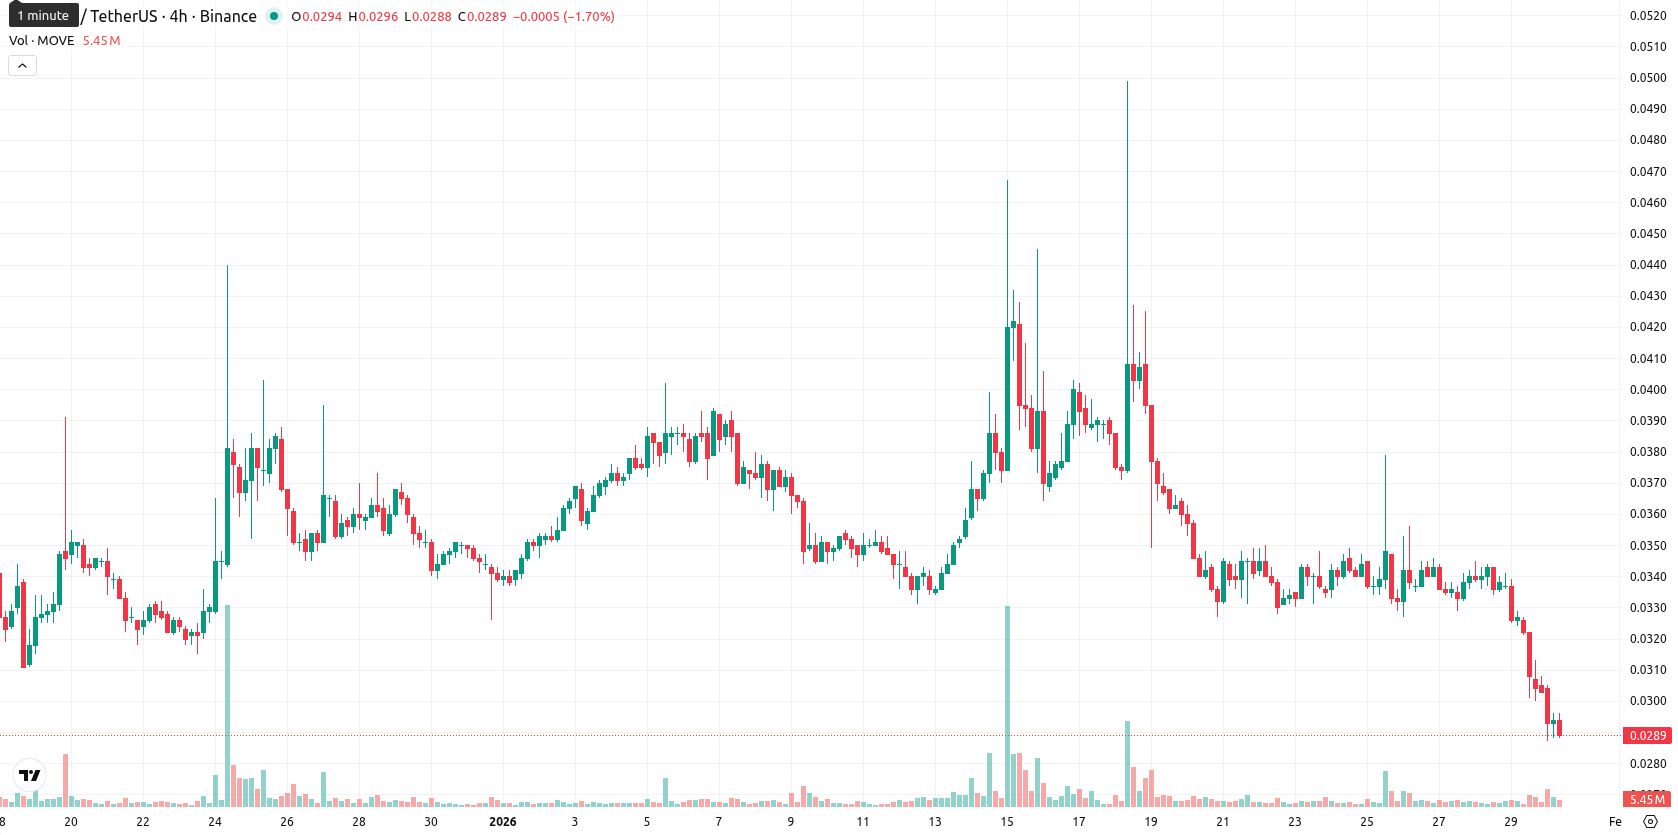
-9.6% for Movement — sellers control within narrow volatility band

Movement (MOVE) is trading at $0.0292, well below the MA-20 ($0.0352), MA-50 ($0.0358), and MA-200 ($0.0854), signaling strong pressure from sellers across all timeframes. The current session saw no gap on the open, with the price dropping 9.6% and now sitting close to the day’s low within a narrow intraday range, indicating high volatility and persistent selling pressure from the opening bell.
Highlights
- MOVE is trading at $0.0292, well below MA-20 ($0.0352), MA-50 ($0.0358), and MA-200 ($0.0854), confirming strong multi-timeframe bearish pressure.
- Bearish momentum prevails with daily and weekly MACD pointing lower, daily ADX above 28, and multiple oversold signals (RSI 35.25 D1, 28.96 W1; CCI –124.99 D1; Stoch RSI 0.0000 D1).
- Expected five-day range is $0.0270–$0.0310, with a less than 20% probability of a bounce; a break below $0.0270 could trigger further downside.
Bearish momentum persists despite oversold technical signals
Momentum signals are dominated by bearish readings: the MACD on daily and weekly timeframes points to ongoing downside, while the ADX daily remains above 28 and flashes a Buy, hinting at a sustained trend but diverging from the weekly Sell reading. Oversold signals are evident from the RSI (35.25 D1, 28.96 W1), Stochastic RSI (0.0000 D1), and CCI (–124.99 D1), yet the Bull/Bear Power also forecasts Sell, confirming that sellers still dominate despite technical oversold conditions. The Awesome Oscillator is neutral on the daily chart and does not reinforce the downtrend. The nearest dynamic resistance on the daily chart is the Ichimoku Kijun at $0.0400, while no immediate support is indicated by these trend-following tools.
Further downside likely as narrow range signals limited recovery
For the next five trading days, MOVE is expected to remain within a typical volatility band of $0.0270 – $0.0310 around current levels. The probability of a price increase is very low (less than 20%), so further downside is the more likely scenario. The baseline scenario is sideways consolidation in this narrow corridor, while a bullish outcome would require a move above $0.0310 and especially the Ichimoku Kijun at $0.0400. A bearish scenario could be triggered by a breakdown below $0.0270, leading to additional selling — daily and weekly technicals support a cautious stance.
Last time, analysts noted that Movement (MOVE) is trading well below all key moving averages, facing persistent bearish momentum reinforced by oversold signals across RSI, Stoch RSI, and CCI, with MACD and ADX indicating continued seller control. The asset encounters dynamic resistance at $0.0400, lacks clear immediate support, and endures elevated volatility, underscoring sustained downside risk.


-
 Afghanistan
-
 Albania
-
 Algeria
-
 Angola
-
 Argentina
-
 Armenia
-
 Australia
-
 Austria
-
 Azerbaijan
-
 Bahamas
-
 Bahrain
-
 Bangladesh
-
 Belarus
-
 Belgium
-
 Bolivia
-
 Botswana
-
 Brazil
-
 Brunei
-
 Bulgaria
-
 Cambodia
-
 Cameroon
-
 Canada
-
 Chile
Chile
-
 China
China
-
 Colombia
-
 Congo
Congo
-
 Costa Rica
-
 Cote d'Ivoire
-
 Croatia
-
 Cuba
Cuba
-
 Cyprus
-
 Czechia
-
 DR Congo
-
 Denmark
-
 Dominican Republic
-
 Ecuador
-
 Egypt
Egypt
-
 El Salvador
-
 Estonia
-
 Eswatini
-
 Ethiopia
-
 Finland
-
 France
-
 Georgia
-
 Germany
-
 Ghana
Ghana
-
 Greece
-
 Haiti
Haiti
-
 Hong Kong
-
 Hungary
-
 India
India
-
 Indonesia
-
 Iran, Islamic republic
-
 Iraq
Iraq
-
 Ireland
-
 Israel
-
 Italy
Italy
-
 Jamaica
-
 Japan
Japan
-
 Jordan
-
 Kazakhstan
-
 Kenya
Kenya
-
 Korea
Korea
-
 Kuwait
-
 Kyrgyzstan
-
 Laos
Laos
-
 Latvia
-
 Lebanon
-
 Lesotho
-
 Libya
Libya
-
 Lithuania
-
 Luxembourg
-
 Madagascar
-
 Malaysia
-
 Malta
Malta
-
 Mauritius
-
 Mexico
-
 Moldova
-
 Mongolia
-
 Montenegro
-
 Morocco
-
 Mozambique
-
 Myanmar
-
 Namibia
-
 Nepal
Nepal
-
 Netherlands
-
 New Zealand
-
 Nigeria
-
 North Macedonia
-
 Norway
-
 Oman
Oman
-
 Pakistan
-
 Palestine
-
 Panama
-
 Papua New Guinea
-
 Paraguay
-
 Peru
Peru
-
 Philippines
-
 Poland
-
 Portugal
-
 Puerto Rico
-
 Qatar
Qatar
-
 Reunion
-
 Romania
-
 Rwanda
-
 Saudi Arabia
-
 Serbia
-
 Singapore
-
 Slovakia
-
 Slovenia
-
 Somalia
-
 South Africa
-
 Spain
Spain
-
 Sri Lanka
-
 Sweden
-
 Switzerland
-
 Syria
Syria
-
 Taiwan
-
 Tajikistan
-
 Tanzania
-
 Thailand
-
 Trinidad and Tobago
-
 Tunisia
-
 Turkey
-
 UAE
UAE
-
 Uganda
-
 Ukraine
-
 United Kingdom
-
United States
-
 Uruguay
-
 Uzbekistan
-
 Venezuela
-
 Vietnam
-
 Yemen
Yemen
-
 Zambia
-
 Zimbabwe
- Forex
- Crypto
