
Bearish technicals keep Flow below Ichimoku Kijun resistance — down nearly 8%

Flow (FLOW) is trading below the MA-20 ($0.0695), MA-50 ($0.1025), and MA-200 ($0.2728), reflecting persistent seller pressure across short, medium, and long-term periods. The price remains under dynamic resistance at the Ichimoku Kijun ($0.0726) with no immediate technical support available.
FLOW price prediction
Current price:
$ 0.0292
-0.0008
2.67%
Real-time Data
12:03
Daily range
0.0292
 0.0297
Weekly range
0.0281
0.0314
Loading...
Highlights
- FLOW is trading below the MA-20 ($0.0695), MA-50 ($0.1025), and MA-200 ($0.2728), reflecting sustained bearish momentum across all timeframes.
- Momentum indicators including MACD (strong sell), ADX (persistent downtrend), and deep oversold RSI/CCI confirm dominant selling pressure and ongoing volatility.
- Expected five-day price range is $0.0462–$0.0598, with less than a 20% probability of price increase and risk of new lows if $0.0462 breaks.
Bearish momentum sustained as oversold signals and volatility intensify
Momentum signals remain decisively bearish: both MACD and ADX indicate strong selling pressure, supported by a negative MACD signal and ADX confirming a persistent downtrend. RSI and Commodity Channel Index are both deep in oversold territory, while the Stochastic RSI lingers near extreme overbought levels, highlighting a divergence and ongoing volatility. Bull/Bear Power favors sellers, and the Awesome Oscillator signals that the downward trend is likely to continue. Price dropped 7.96% intraday from the last close, with trading currently near the session’s low at $0.0497 amid high volatility and continued downside momentum.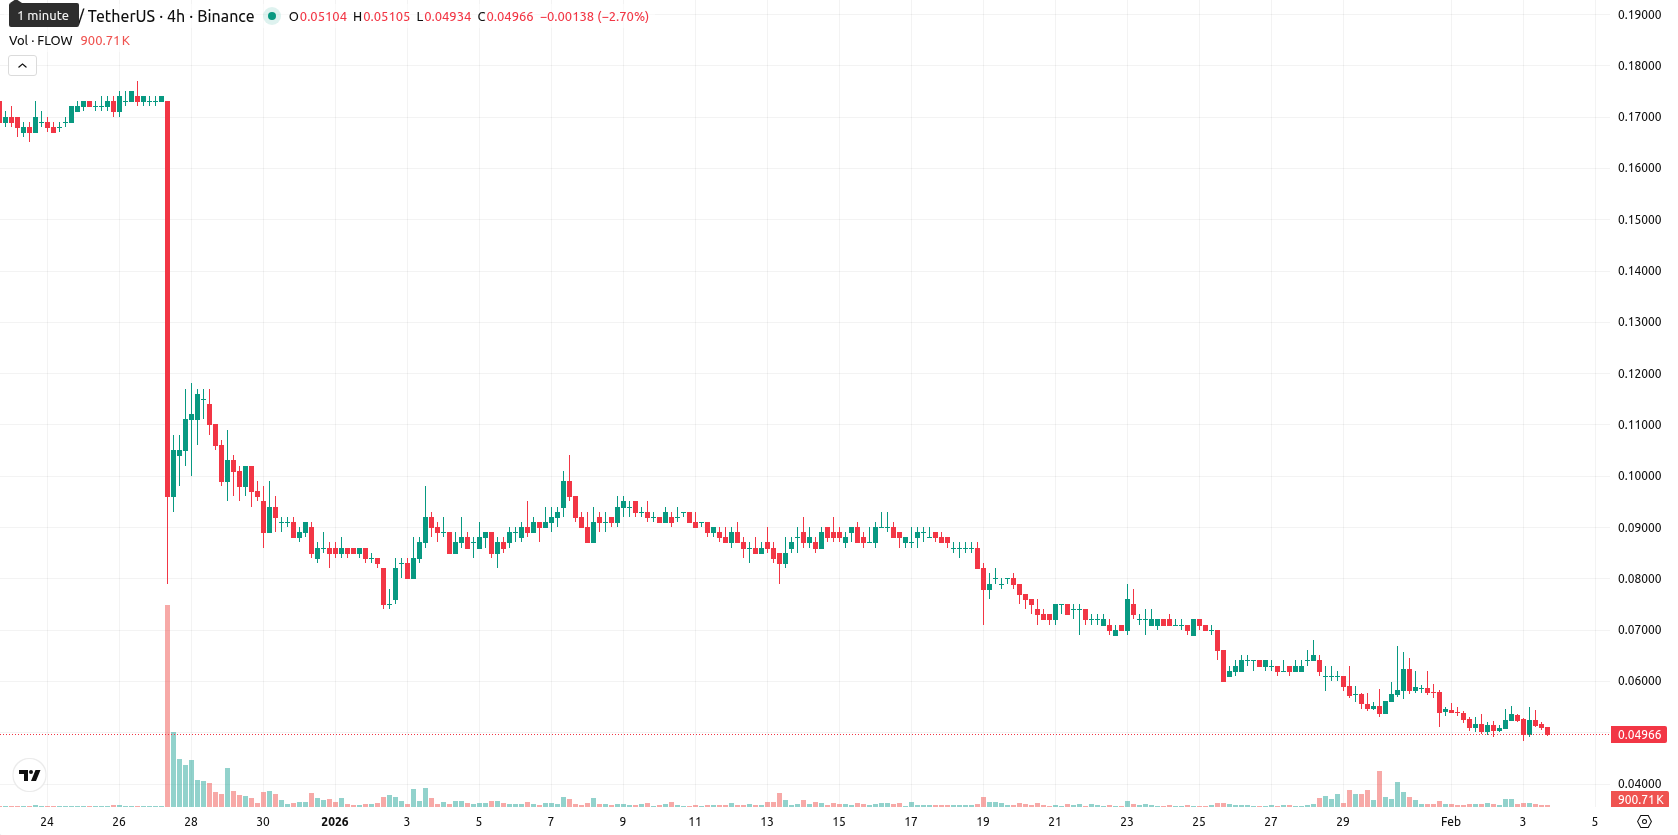
Limited rebound prospects as downside bias dominates short-term range
In the short term, FLOW is expected to trade in a $0.0462–$0.0598 volatility band relative to current levels over the next five trading days. With all weekly indicators, including MA-50, RSI, ADX, and MACD, issuing sell signals, the odds of price appreciation are low (less than 20%), suggesting that further downside remains more likely. The baseline forecast is for sideways trading within this range, though a bullish reversal would require a move above $0.0598 on increased buying, while a bearish breach below $0.0462 could expose FLOW to new lows.
Anton Kharitonov, expert at Traders Union, sees continued downside risk for FLOW given persistent bearish momentum and a lack of positive news drivers. The analyst notes that all major trend and momentum indicators confirm sustained selling and high volatility. With price action holding below critical resistance and no technical support nearby, he remains cautious on any rebound. "Base case remains sideways or lower — until FLOW reclaims $0.0598 with strong buying, I see little justification for a bullish outlook."
Last time, analysts noted that Flow is trading well below all major moving averages, with persistent downward momentum confirmed by MACD, ADX, and deeply oversold RSI and CCI indicators. Immediate resistance is seen near the Ichimoku Kijun, support forms at recent lows, and technical signals point to continued seller dominance with high downside risk within the expected volatility band.
Source of Data:
FLOW Price Analysis by TU
The analysis is based on a proprietary model combining technical, on-chain, and expert data. Not investment advice. See
methodology
The information is based on forecasts and does not constitute investment advice or a guarantee of future results. Market conditions may change. See our Disclaimer and Editorial Integrity for details.
Subscribe to TU news

Did you like the article?


Latest FLOW News


Weekly Top Bonuses

Top News


Top 5 companies for you

United States
-
 Afghanistan
-
 Albania
-
 Algeria
-
 Angola
-
 Argentina
-
 Armenia
-
 Australia
-
 Austria
-
 Azerbaijan
-
 Bahamas
-
 Bahrain
-
 Bangladesh
-
 Belarus
-
 Belgium
-
 Bolivia
-
 Botswana
-
 Brazil
-
 Brunei
-
 Bulgaria
-
 Cambodia
-
 Cameroon
-
 Canada
-
 Chile
Chile
-
 China
China
-
 Colombia
-
 Congo
Congo
-
 Costa Rica
-
 Cote d'Ivoire
-
 Croatia
-
 Cuba
Cuba
-
 Cyprus
-
 Czechia
-
 DR Congo
-
 Denmark
-
 Dominican Republic
-
 Ecuador
-
 Egypt
Egypt
-
 El Salvador
-
 Estonia
-
 Eswatini
-
 Ethiopia
-
 Finland
-
 France
-
 Georgia
-
 Germany
-
 Ghana
Ghana
-
 Greece
-
 Haiti
Haiti
-
 Hong Kong
-
 Hungary
-
 India
India
-
 Indonesia
-
 Iran, Islamic republic
-
 Iraq
Iraq
-
 Ireland
-
 Israel
-
 Italy
Italy
-
 Jamaica
-
 Japan
Japan
-
 Jordan
-
 Kazakhstan
-
 Kenya
Kenya
-
 Korea
Korea
-
 Kuwait
-
 Kyrgyzstan
-
 Laos
Laos
-
 Latvia
-
 Lebanon
-
 Lesotho
-
 Libya
Libya
-
 Lithuania
-
 Luxembourg
-
 Madagascar
-
 Malaysia
-
 Malta
Malta
-
 Mauritius
-
 Mexico
-
 Moldova
-
 Mongolia
-
 Montenegro
-
 Morocco
-
 Mozambique
-
 Myanmar
-
 Namibia
-
 Nepal
Nepal
-
 Netherlands
-
 New Zealand
-
 Nigeria
-
 North Macedonia
-
 Norway
-
 Oman
Oman
-
 Pakistan
-
 Palestine
-
 Panama
-
 Papua New Guinea
-
 Paraguay
-
 Peru
Peru
-
 Philippines
-
 Poland
-
 Portugal
-
 Puerto Rico
-
 Qatar
Qatar
-
 Reunion
-
 Romania
-
 Rwanda
-
 Saudi Arabia
-
 Serbia
-
 Singapore
-
 Slovakia
-
 Slovenia
-
 Somalia
-
 South Africa
-
 Spain
Spain
-
 Sri Lanka
-
 Sweden
-
 Switzerland
-
 Syria
Syria
-
 Taiwan
-
 Tajikistan
-
 Tanzania
-
 Thailand
-
 Trinidad and Tobago
-
 Tunisia
-
 Turkey
-
 UAE
UAE
-
 Uganda
-
 Ukraine
-
 United Kingdom
-
United States
-
 Uruguay
-
 Uzbekistan
-
 Venezuela
-
 Vietnam
-
 Yemen
Yemen
-
 Zambia
-
 Zimbabwe
- Forex
- Crypto
Live News
