
Jupiter: Lack of immediate support drives 7.03% decline amid selling pressure

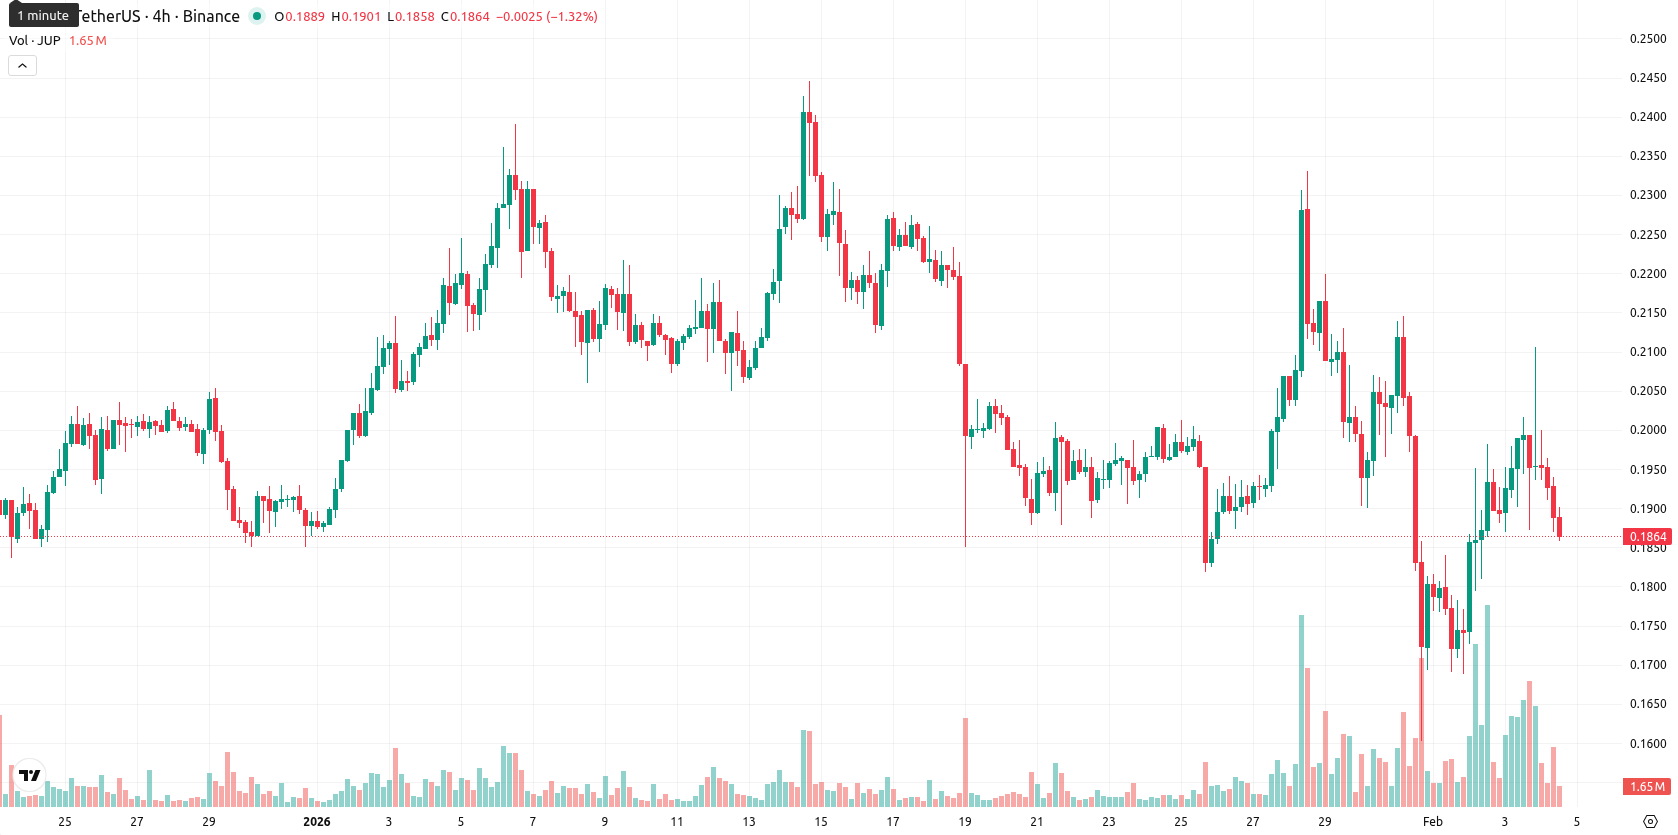
Jupiter (JUP) is trading at $0.1864, down 7.03% on the day and lingering near the lower end of its daily range. The token is currently below its MA-20 ($0.1996), MA-50 ($0.2019), and MA-200 ($0.3624), showing persistent bearish pressure across all major timeframes.
Highlights
- Jupiter secured its first external investment with a $35 million strategic deal from ParaFi Capital, fully settled in its JupUSD stablecoin.
- The funding will support institutional participation and product diversification, marking a milestone for Jupiter’s expansion within the Solana DeFi ecosystem.
- JUP trades at $0.1864 below key moving averages, facing resistance at $0.2024, with bearish momentum and a likely range between $0.175 and $0.205 over five days.
ParaFi Capital’s stablecoin investment spurs institutional expansion for Jupiter
Jupiter, the leading decentralized liquidity aggregator and exchange on the Solana blockchain, secured its first external investment with a $35 million strategic deal from ParaFi Capital, entirely settled in JupUSD, Jupiter's dollar-pegged stablecoin. This test of Jupiter's stablecoin infrastructure highlights growing institutional interest in its on-chain ecosystem and marks a milestone for the protocol’s expansion. The newly acquired funding will support further development in institutional participation and product diversification, adding to Jupiter's extensive trading volume and suite of DeFi services.
Bearish momentum builds as key supports fail and momentum weakens
JUP is trading below its MA-20, MA-50, and MA-200 levels, emphasizing ongoing bearish momentum. The nearest dynamic resistance lies at the Ichimoku Kijun ($0.2024), with no immediate dynamic support above the current price. Momentum readings are negative: the MACD points to continued downside, the ADX is weak at 17.22, and the RSI and CCI remain under selling pressure (though without oversold readings). The Stochastic RSI is neutral on the daily chart yet signals oversold conditions intraday, while Bull/Bear Power suggests buyer interest on the daily but contradicts the broader bearish trend, which is confirmed by the Awesome Oscillator.
Downside bias dominates as low breakout odds guide near-term outlook
For the next five trading days, typical volatility is expected within a $0.175 to $0.205 band. The probability of a sustained upward move remains below 20%, making further declines more likely. JUP is expected to consolidate sideways within this price range, with consolidation punctuated by the possibility of a drop below $0.175 if selling pressure intensifies, or a potential breakout only if resistance at $0.2024 is breached.
Previously it was reported that Jupiter (JUP) is showing short-term bullish momentum as it trades above its 20- and 50-day moving averages but remains under long-term bearish pressure, well below its 200-day moving average. Despite strong intraday buying and price action near today’s highs, mixed momentum indicators—including a negative MACD, bearish RSI/CCI, and overbought Stoch RSI—signal elevated pullback risk and direction uncertainty as bulls test resistance levels.


Latest Jupiter News


-
 Afghanistan
-
 Albania
-
 Algeria
-
 Angola
-
 Argentina
-
 Armenia
-
 Australia
-
 Austria
-
 Azerbaijan
-
 Bahamas
-
 Bahrain
-
 Bangladesh
-
 Belarus
-
 Belgium
-
 Bolivia
-
 Botswana
-
 Brazil
-
 Brunei
-
 Bulgaria
-
 Cambodia
-
 Cameroon
-
 Canada
-
 Chile
Chile
-
 China
China
-
 Colombia
-
 Congo
Congo
-
 Costa Rica
-
 Cote d'Ivoire
-
 Croatia
-
 Cuba
Cuba
-
 Cyprus
-
 Czechia
-
 DR Congo
-
 Denmark
-
 Dominican Republic
-
 Ecuador
-
 Egypt
Egypt
-
 El Salvador
-
 Estonia
-
 Eswatini
-
 Ethiopia
-
 Finland
-
 France
-
 Georgia
-
 Germany
-
 Ghana
Ghana
-
 Greece
-
 Haiti
Haiti
-
 Hong Kong
-
 Hungary
-
 India
India
-
 Indonesia
-
 Iran, Islamic republic
-
 Iraq
Iraq
-
 Ireland
-
 Israel
-
 Italy
Italy
-
 Jamaica
-
 Japan
Japan
-
 Jordan
-
 Kazakhstan
-
 Kenya
Kenya
-
 Korea
Korea
-
 Kuwait
-
 Kyrgyzstan
-
 Laos
Laos
-
 Latvia
-
 Lebanon
-
 Lesotho
-
 Libya
Libya
-
 Lithuania
-
 Luxembourg
-
 Madagascar
-
 Malaysia
-
 Malta
Malta
-
 Mauritius
-
 Mexico
-
 Moldova
-
 Mongolia
-
 Montenegro
-
 Morocco
-
 Mozambique
-
 Myanmar
-
 Namibia
-
 Nepal
Nepal
-
 Netherlands
-
 New Zealand
-
 Nigeria
-
 North Macedonia
-
 Norway
-
 Oman
Oman
-
 Pakistan
-
 Palestine
-
 Panama
-
 Papua New Guinea
-
 Paraguay
-
 Peru
Peru
-
 Philippines
-
 Poland
-
 Portugal
-
 Puerto Rico
-
 Qatar
Qatar
-
 Reunion
-
 Romania
-
 Rwanda
-
 Saudi Arabia
-
 Serbia
-
 Singapore
-
 Slovakia
-
 Slovenia
-
 Somalia
-
 South Africa
-
 Spain
Spain
-
 Sri Lanka
-
 Sweden
-
 Switzerland
-
 Syria
Syria
-
 Taiwan
-
 Tajikistan
-
 Tanzania
-
 Thailand
-
 Trinidad and Tobago
-
 Tunisia
-
 Turkey
-
 UAE
UAE
-
 Uganda
-
 Ukraine
-
 United Kingdom
-
United States
-
 Uruguay
-
 Uzbekistan
-
 Venezuela
-
 Vietnam
-
 Yemen
Yemen
-
 Zambia
-
 Zimbabwe
- Forex
- Crypto
