
Jupiter: Weak indicators and dynamic resistance drive a sharp 14.99% decline

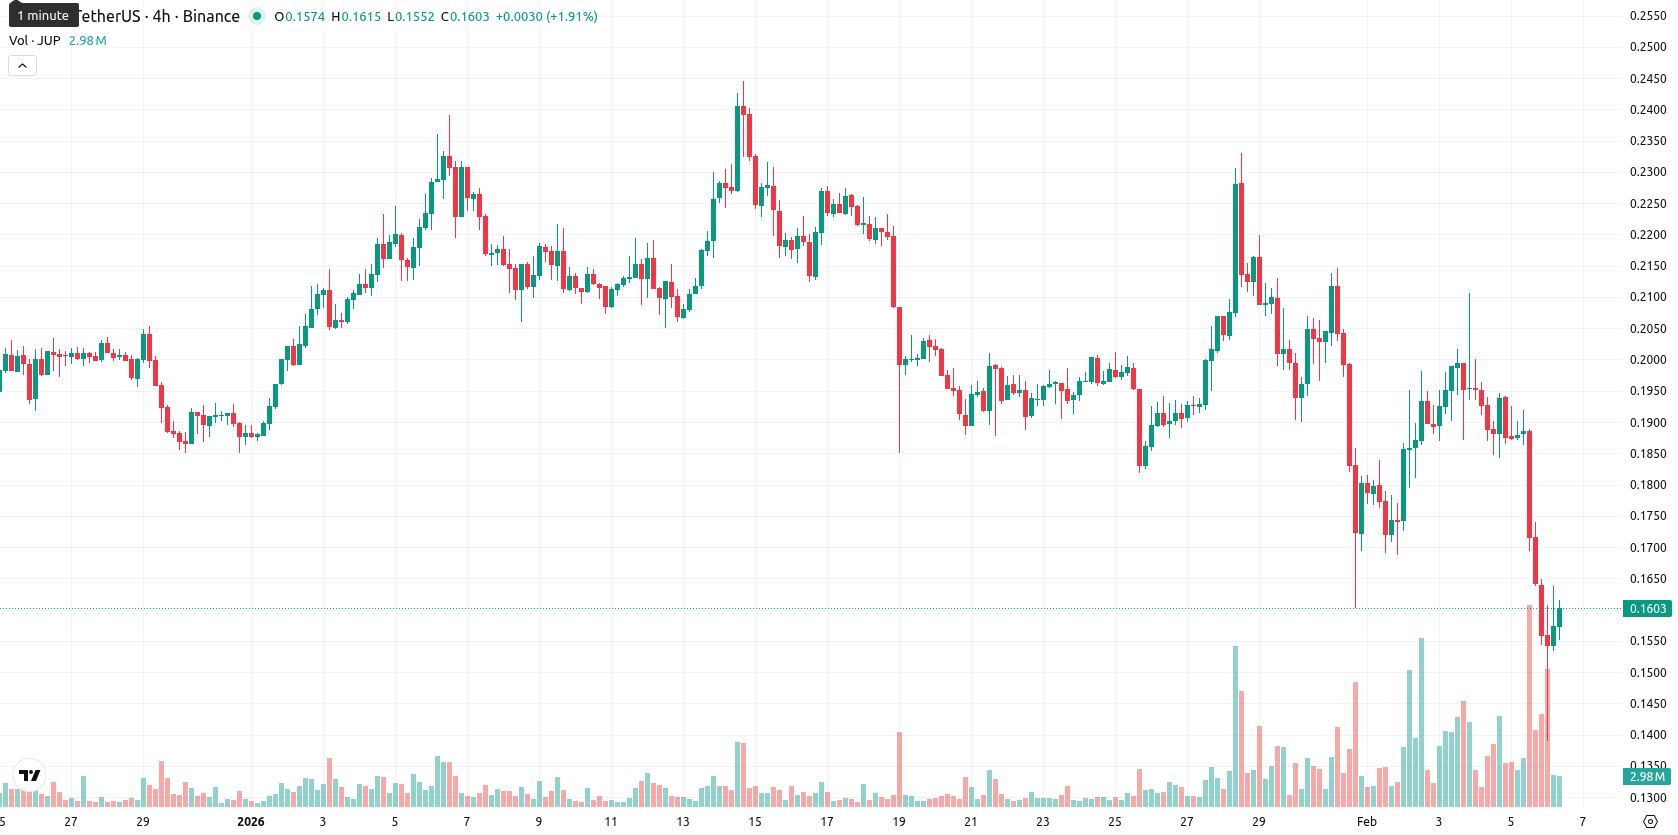
Jupiter (JUP) is trading at $0.1599, well below the MA-20 ($0.1946), MA-50 ($0.2012), and MA-200 ($0.3586), confirming a firmly bearish structure across short, medium, and long-term trends with persistent pressure from sellers.
Highlights
- Jupiter secured a $35 million investment from ParaFi Capital in its first major funding round, signaling strong institutional confidence and upcoming development.
- Polymarket will integrate with Jupiter, expanding the protocol’s reach within the Solana DeFi market amid a $365 million annualized revenue run rate.
- JUP trades at $0.1599, well below major moving averages, with technicals signaling a firmly bearish trend and potential support around the $0.1400 zone if selling accelerates.
Institutional investment grows as ParaFi funding and Polymarket integration boost Jupiter
Jupiter has secured a $35 million investment from ParaFi Capital, marking its first major external funding round for upcoming development. The protocol also announced that Polymarket will be integrating into its ecosystem, expanding its presence within the Solana DeFi market. Additionally, recent data highlights Jupiter's annualized revenue run rate at approximately $365 million, underlining strong institutional interest and continued growth.
Bearish momentum dominates as oversold signals and resistance limit upside
The nearest significant dynamic resistance is reflected by the Ichimoku Kijun at $0.1995, with immediate support levels not clearly defined — suggesting potential support near today's low or around the $0.1400 area if selling persists. Momentum indicators reinforce the downward outlook: MACD signals Sell, ADX reads weak at 16.6, and oscillators show oversold conditions, with RSI at 36.3, Stochastic RSI at the lower bound, and CCI deep in oversold territory. Bull/Bear Power is marginally positive intraday but the Awesome Oscillator aligns with the strong bearish trend. The session opened lower with a gap from $0.1881 to $0.156, slipping 14.99% and settling near the upper end of today's volatile range ($0.1389 – $0.1637), as sellers maintained control.
Limited recovery prospects as volatility and downside risks persist
Over the next five trading days, JUP is expected to fluctuate within a typical volatility band between $0.145 and $0.175. With all weekly indicators (MA-50, RSI, ADX, and MACD) signaling Sell or Strong Sell, the potential for price recovery remains low, with a probability of less than 20%. Sideways consolidation within this range is likely unless a breakout above the $0.175 – $0.180 resistance area occurs. If support fails and bearish momentum intensifies, a breakdown below $0.145 could push JUP to new local lows.
Previously it was reported that Jupiter trades near the bottom of its daily range, exhibiting sustained bearish momentum as it sits below all major moving averages and key support levels, with technical indicators such as the MACD, ADX, RSI, and CCI signaling continued downside pressure and weak momentum. Resistance is seen at $0.2024, and with no immediate dynamic support, the near-term outlook favors sideways consolidation with a strong downside bias.


Latest Jupiter News


-
 Afghanistan
-
 Albania
-
 Algeria
-
 Angola
-
 Argentina
-
 Armenia
-
 Australia
-
 Austria
-
 Azerbaijan
-
 Bahamas
-
 Bahrain
-
 Bangladesh
-
 Belarus
-
 Belgium
-
 Bolivia
-
 Botswana
-
 Brazil
-
 Brunei
-
 Bulgaria
-
 Cambodia
-
 Cameroon
-
 Canada
-
 Chile
Chile
-
 China
China
-
 Colombia
-
 Congo
Congo
-
 Costa Rica
-
 Cote d'Ivoire
-
 Croatia
-
 Cuba
Cuba
-
 Cyprus
-
 Czechia
-
 DR Congo
-
 Denmark
-
 Dominican Republic
-
 Ecuador
-
 Egypt
Egypt
-
 El Salvador
-
 Estonia
-
 Eswatini
-
 Ethiopia
-
 Finland
-
 France
-
 Georgia
-
 Germany
-
 Ghana
Ghana
-
 Greece
-
 Haiti
Haiti
-
 Hong Kong
-
 Hungary
-
 India
India
-
 Indonesia
-
 Iran, Islamic republic
-
 Iraq
Iraq
-
 Ireland
-
 Israel
-
 Italy
Italy
-
 Jamaica
-
 Japan
Japan
-
 Jordan
-
 Kazakhstan
-
 Kenya
Kenya
-
 Korea
Korea
-
 Kuwait
-
 Kyrgyzstan
-
 Laos
Laos
-
 Latvia
-
 Lebanon
-
 Lesotho
-
 Libya
Libya
-
 Lithuania
-
 Luxembourg
-
 Madagascar
-
 Malaysia
-
 Malta
Malta
-
 Mauritius
-
 Mexico
-
 Moldova
-
 Mongolia
-
 Montenegro
-
 Morocco
-
 Mozambique
-
 Myanmar
-
 Namibia
-
 Nepal
Nepal
-
 Netherlands
-
 New Zealand
-
 Nigeria
-
 North Macedonia
-
 Norway
-
 Oman
Oman
-
 Pakistan
-
 Palestine
-
 Panama
-
 Papua New Guinea
-
 Paraguay
-
 Peru
Peru
-
 Philippines
-
 Poland
-
 Portugal
-
 Puerto Rico
-
 Qatar
Qatar
-
 Reunion
-
 Romania
-
 Rwanda
-
 Saudi Arabia
-
 Serbia
-
 Singapore
-
 Slovakia
-
 Slovenia
-
 Somalia
-
 South Africa
-
 Spain
Spain
-
 Sri Lanka
-
 Sweden
-
 Switzerland
-
 Syria
Syria
-
 Taiwan
-
 Tajikistan
-
 Tanzania
-
 Thailand
-
 Trinidad and Tobago
-
 Tunisia
-
 Turkey
-
 UAE
UAE
-
 Uganda
-
 Ukraine
-
 United Kingdom
-
United States
-
 Uruguay
-
 Uzbekistan
-
 Venezuela
-
 Vietnam
-
 Yemen
Yemen
-
 Zambia
-
 Zimbabwe
- Forex
- Crypto
