
Bearish signals persist across timeframes — Kava drops 7.01%

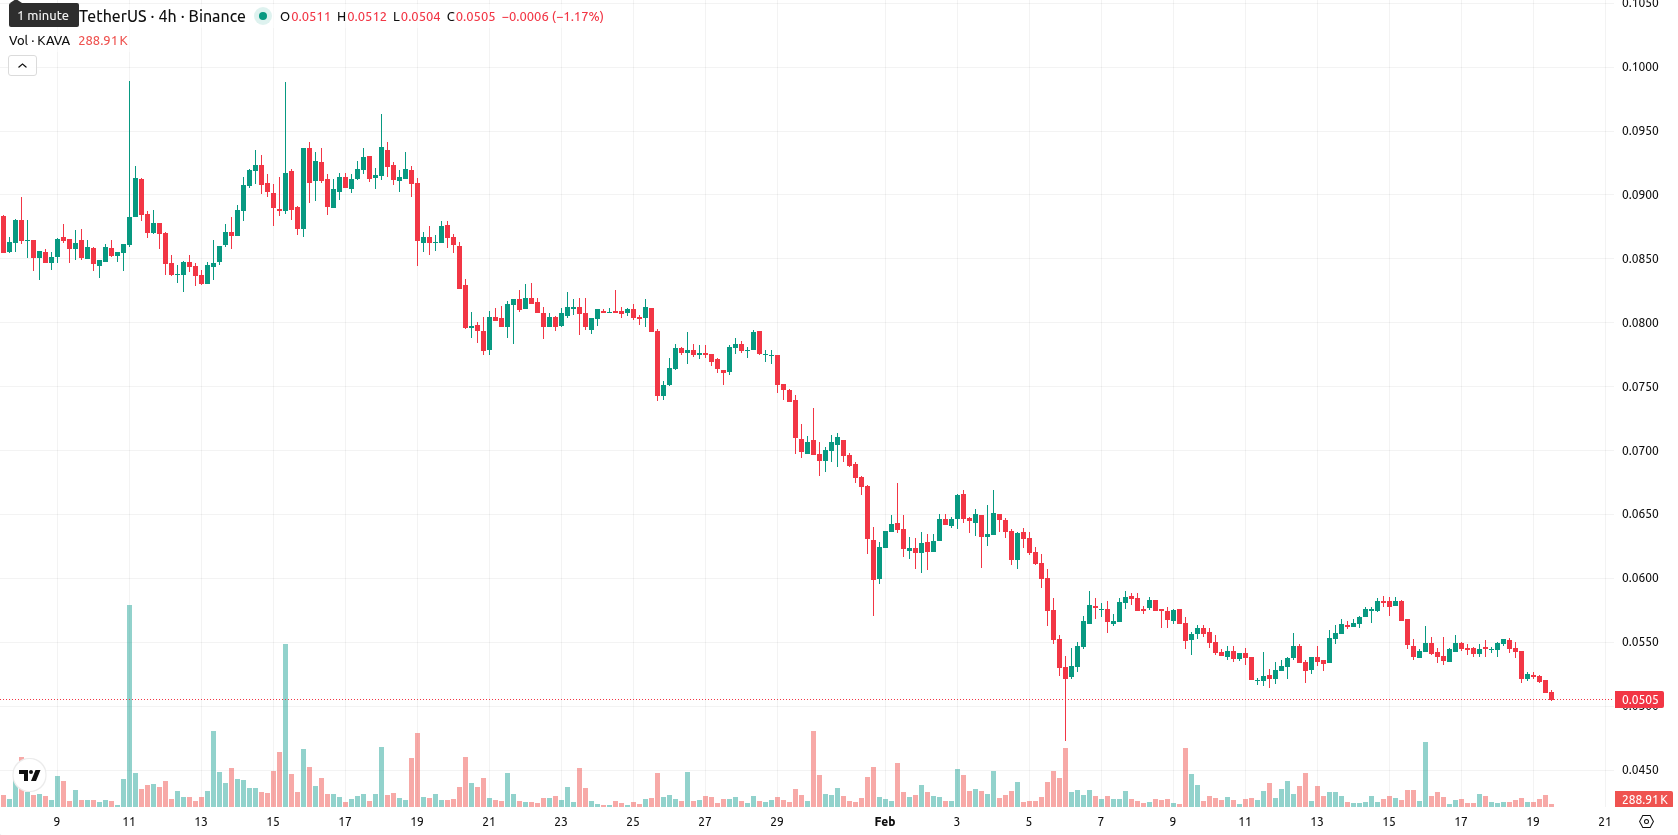
Kava (KAVA) is trading at $0.0504 after a 7.01% daily slide, extending its retreat below the MA-20 ($0.0579), MA-50 ($0.0732), and MA-200 ($0.1906) — a clear sign of persistent bearish pressure across all timeframes.
Highlights
- KAVA is trading at $0.0504, well below its MA-20 ($0.0579), MA-50 ($0.0732), and MA-200 ($0.1906), confirming a strong bearish trend across all timeframes.
- Momentum indicators—MACD (Strong Sell), ADX (elevated), negative Bull/Bear Power—indicate sellers are dominant, while RSI (32.48) and CCI (-84.71) signal near-oversold conditions.
- Expected range for the next five days is $0.0470–$0.0535, with over 80% probability of further declines unless price breaks above $0.0535 resistance.
Momentum weakens further as key levels break and indicators turn oversold
Technically, KAVA is entrenched in a strong downtrend, trading beneath major short-, medium-, and long-term moving averages. The Ichimoku Kijun now presents resistance at $0.0649 following recent weakness. Momentum indicators support this negative outlook, with the MACD showing a Strong Sell, elevated ADX values, and negative Bull/Bear Power. RSI (32.48) and CCI (-84.71) indicate the asset is close to oversold, while the Stochastic RSI remains neutral on the daily timeframe and oversold on lower timeframes — suggesting selling could be losing steam. The Awesome Oscillator is inconclusive.
Downside risks persist as volatility bands narrow and oversold signals emerge
For the next five trading days, the projected volatility band for KAVA is $0.0470 to $0.0535. There is a very high probability — above 80% — of continued declines, though oversold signals could prompt a brief pause or short-term sideways consolidation within this range. A move above $0.0535 could trigger a recovery toward the Ichimoku Kijun resistance near $0.0649, while a break below $0.0470 may accelerate the downtrend toward new local lows.
Previously it was reported that Kava is trading well below key moving averages, with strong bearish momentum confirmed by MACD and ADX on multiple timeframes and RSI indicating persistent oversold conditions. Immediate resistance is set around the Ichimoku Kijun, with limited support just beneath current levels, suggesting a high probability of continued downside and little chance of a sustained rebound.


-
 Afghanistan
-
 Albania
-
 Algeria
-
 Angola
-
 Argentina
-
 Armenia
-
 Australia
-
 Austria
-
 Azerbaijan
-
 Bahamas
-
 Bahrain
-
 Bangladesh
-
 Belarus
-
 Belgium
-
 Bolivia
-
 Botswana
-
 Brazil
-
 Brunei
-
 Bulgaria
-
 Cambodia
-
 Cameroon
-
 Canada
-
 Chile
Chile
-
 China
China
-
 Colombia
-
 Congo
Congo
-
 Costa Rica
-
 Cote d'Ivoire
-
 Croatia
-
 Cuba
Cuba
-
 Cyprus
-
 Czechia
-
 DR Congo
-
 Denmark
-
 Dominican Republic
-
 Ecuador
-
 Egypt
Egypt
-
 El Salvador
-
 Estonia
-
 Eswatini
-
 Ethiopia
-
 Finland
-
 France
-
 Georgia
-
 Germany
-
 Ghana
Ghana
-
 Greece
-
 Haiti
Haiti
-
 Hong Kong
-
 Hungary
-
 India
India
-
 Indonesia
-
 Iran, Islamic republic
-
 Iraq
Iraq
-
 Ireland
-
 Israel
-
 Italy
Italy
-
 Jamaica
-
 Japan
Japan
-
 Jordan
-
 Kazakhstan
-
 Kenya
Kenya
-
 Korea
Korea
-
 Kuwait
-
 Kyrgyzstan
-
 Laos
Laos
-
 Latvia
-
 Lebanon
-
 Lesotho
-
 Libya
Libya
-
 Lithuania
-
 Luxembourg
-
 Madagascar
-
 Malaysia
-
 Malta
Malta
-
 Mauritius
-
 Mexico
-
 Moldova
-
 Mongolia
-
 Montenegro
-
 Morocco
-
 Mozambique
-
 Myanmar
-
 Namibia
-
 Nepal
Nepal
-
 Netherlands
-
 New Zealand
-
 Nigeria
-
 North Macedonia
-
 Norway
-
 Oman
Oman
-
 Pakistan
-
 Palestine
-
 Panama
-
 Papua New Guinea
-
 Paraguay
-
 Peru
Peru
-
 Philippines
-
 Poland
-
 Portugal
-
 Puerto Rico
-
 Qatar
Qatar
-
 Reunion
-
 Romania
-
 Rwanda
-
 Saudi Arabia
-
 Serbia
-
 Singapore
-
 Slovakia
-
 Slovenia
-
 Somalia
-
 South Africa
-
 Spain
Spain
-
 Sri Lanka
-
 Sweden
-
 Switzerland
-
 Syria
Syria
-
 Taiwan
-
 Tajikistan
-
 Tanzania
-
 Thailand
-
 Trinidad and Tobago
-
 Tunisia
-
 Turkey
-
 UAE
UAE
-
 Uganda
-
 Ukraine
-
 United Kingdom
-
United States
-
 Uruguay
-
 Uzbekistan
-
 Venezuela
-
 Vietnam
-
 Yemen
Yemen
-
 Zambia
-
 Zimbabwe
- Forex
- Crypto
