
+7.18% for Flow — volatility spike brings relief to sellers

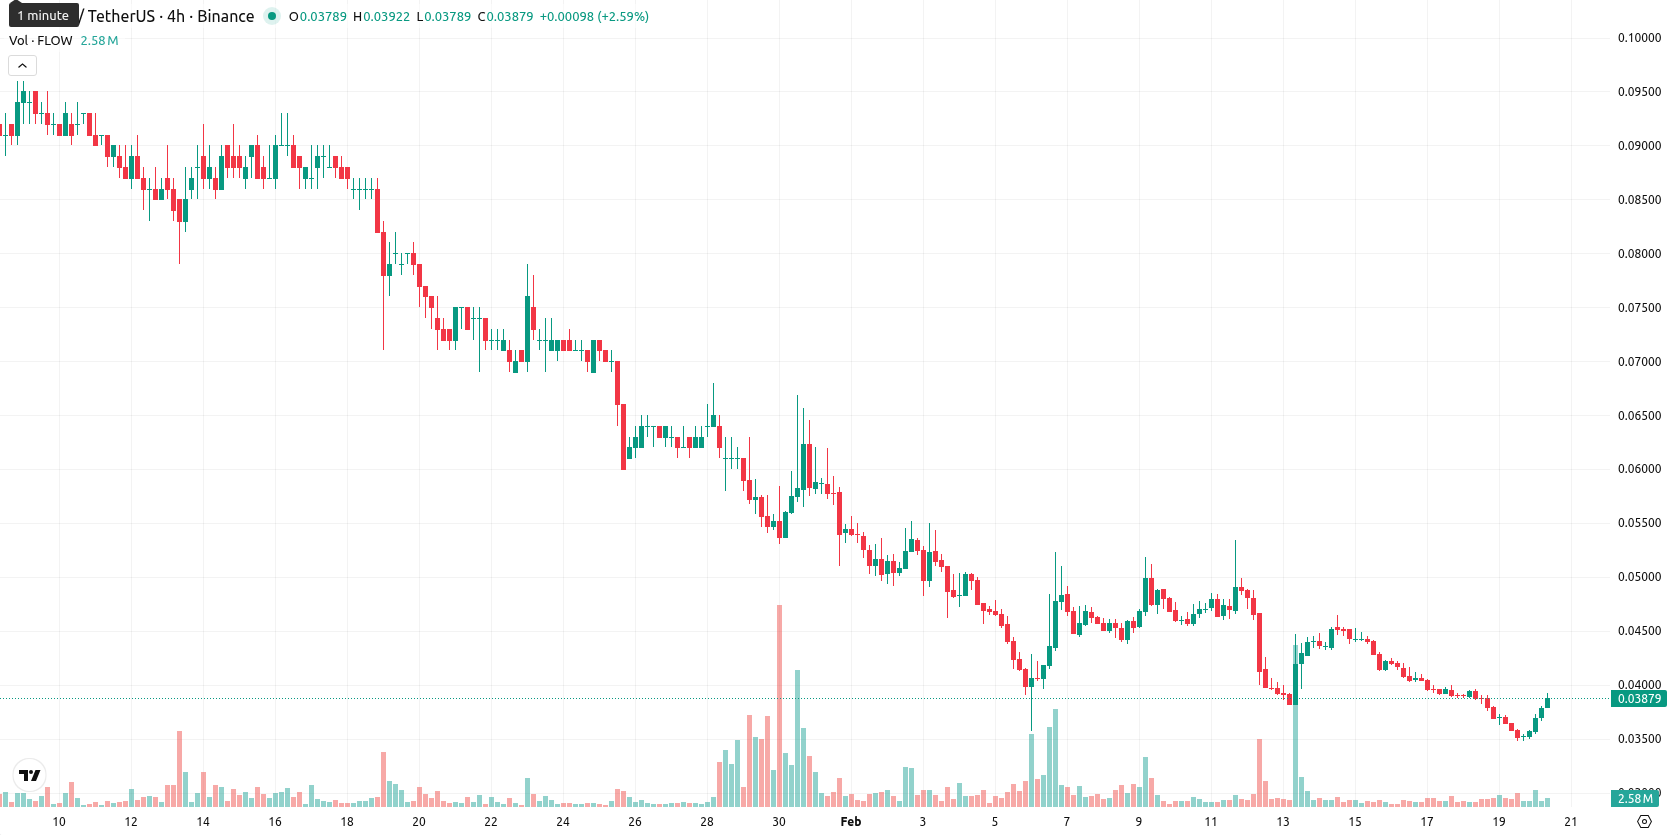
Flow (FLOW) is trading at $0.0388, reflecting a 7.18% gain today and positioning the asset below its MA-20 ($0.0448), MA-50 ($0.0656), and MA-200 ($0.2422). The price remains under pressure across short-, medium-, and long-term trends, with the Ichimoku Kijun at $0.0534 acting as immediate resistance.
Highlights
- Flow trades at $0.0388, significantly below the MA-20 ($0.0448), MA-50 ($0.0656), and MA-200 ($0.2422), indicating persistent bearish momentum across all timeframes.
- Daily technicals show deeply oversold conditions—RSI at 27.80, Stochastic RSI at 9.10, and CCI at –160.62—implying potential for short-term corrective action despite the dominant downtrend.
- For the next five sessions, price action is expected between $0.0350 (support) and $0.0430 (resistance), with less than 20% probability of upward breakout and risk skewed to the downside.
Deeply oversold signals persist amid strong bearish trend
Momentum for FLOW remains decisively negative: both the MACD (Strong Sell) and ADX (high at 43.64, also Sell) confirm a strong bearish trend. Daily chart readings for RSI (27.80), Stochastic RSI (9.10), and CCI (–160.62) all signal deeply oversold market conditions, and Bull/Bear Power readings show continued seller dominance. The Awesome Oscillator is neutral, providing no immediate directional bias. Despite the price trading near intraday highs following significant volatility, these oversold signals and the sharp bounce from session lows point toward a potential technical divergence.
Sideways trading expected as sell indicators dominate
For the next five sessions, FLOW is expected to trade within a typical volatility band relative to current levels, between $0.0350 and $0.0430. With all major weekly indicators (RSI, ADX, MACD, MA-50) signaling 'Sell,' probability of a sustained price increase remains very low, below 20%. The most likely scenario is continued sideways movement near current prices. A bullish turn would require a confirmed breakout above the $0.0534 resistance, while a drop below $0.0350 could trigger further declines.
Last time, analysts noted that Flow was experiencing persistent bearish momentum, trading below all key moving averages with strong sell signals from MACD, high ADX, and negative Bull/Bear Power readings. The asset remained under heavy selling pressure with oversold RSI and CCI values, limited recovery prospects below the Ichimoku Kijun resistance, and downside risk should prices breach the $0.032 support level.


-
 Afghanistan
-
 Albania
-
 Algeria
-
 Angola
-
 Argentina
-
 Armenia
-
 Australia
-
 Austria
-
 Azerbaijan
-
 Bahamas
-
 Bahrain
-
 Bangladesh
-
 Belarus
-
 Belgium
-
 Bolivia
-
 Botswana
-
 Brazil
-
 Brunei
-
 Bulgaria
-
 Cambodia
-
 Cameroon
-
 Canada
-
 Chile
Chile
-
 China
China
-
 Colombia
-
 Congo
Congo
-
 Costa Rica
-
 Cote d'Ivoire
-
 Croatia
-
 Cuba
Cuba
-
 Cyprus
-
 Czechia
-
 DR Congo
-
 Denmark
-
 Dominican Republic
-
 Ecuador
-
 Egypt
Egypt
-
 El Salvador
-
 Estonia
-
 Eswatini
-
 Ethiopia
-
 Finland
-
 France
-
 Georgia
-
 Germany
-
 Ghana
Ghana
-
 Greece
-
 Haiti
Haiti
-
 Hong Kong
-
 Hungary
-
 India
India
-
 Indonesia
-
 Iran, Islamic republic
-
 Iraq
Iraq
-
 Ireland
-
 Israel
-
 Italy
Italy
-
 Jamaica
-
 Japan
Japan
-
 Jordan
-
 Kazakhstan
-
 Kenya
Kenya
-
 Korea
Korea
-
 Kuwait
-
 Kyrgyzstan
-
 Laos
Laos
-
 Latvia
-
 Lebanon
-
 Lesotho
-
 Libya
Libya
-
 Lithuania
-
 Luxembourg
-
 Madagascar
-
 Malaysia
-
 Malta
Malta
-
 Mauritius
-
 Mexico
-
 Moldova
-
 Mongolia
-
 Montenegro
-
 Morocco
-
 Mozambique
-
 Myanmar
-
 Namibia
-
 Nepal
Nepal
-
 Netherlands
-
 New Zealand
-
 Nigeria
-
 North Macedonia
-
 Norway
-
 Oman
Oman
-
 Pakistan
-
 Palestine
-
 Panama
-
 Papua New Guinea
-
 Paraguay
-
 Peru
Peru
-
 Philippines
-
 Poland
-
 Portugal
-
 Puerto Rico
-
 Qatar
Qatar
-
 Reunion
-
 Romania
-
 Rwanda
-
 Saudi Arabia
-
 Serbia
-
 Singapore
-
 Slovakia
-
 Slovenia
-
 Somalia
-
 South Africa
-
 Spain
Spain
-
 Sri Lanka
-
 Sweden
-
 Switzerland
-
 Syria
Syria
-
 Taiwan
-
 Tajikistan
-
 Tanzania
-
 Thailand
-
 Trinidad and Tobago
-
 Tunisia
-
 Turkey
-
 UAE
UAE
-
 Uganda
-
 Ukraine
-
 United Kingdom
-
United States
-
 Uruguay
-
 Uzbekistan
-
 Venezuela
-
 Vietnam
-
 Yemen
Yemen
-
 Zambia
-
 Zimbabwe
- Forex
- Crypto
