
SOL extends decline, testing support near $80 with weak technical signals and dominant negative momentum – weekly forecast

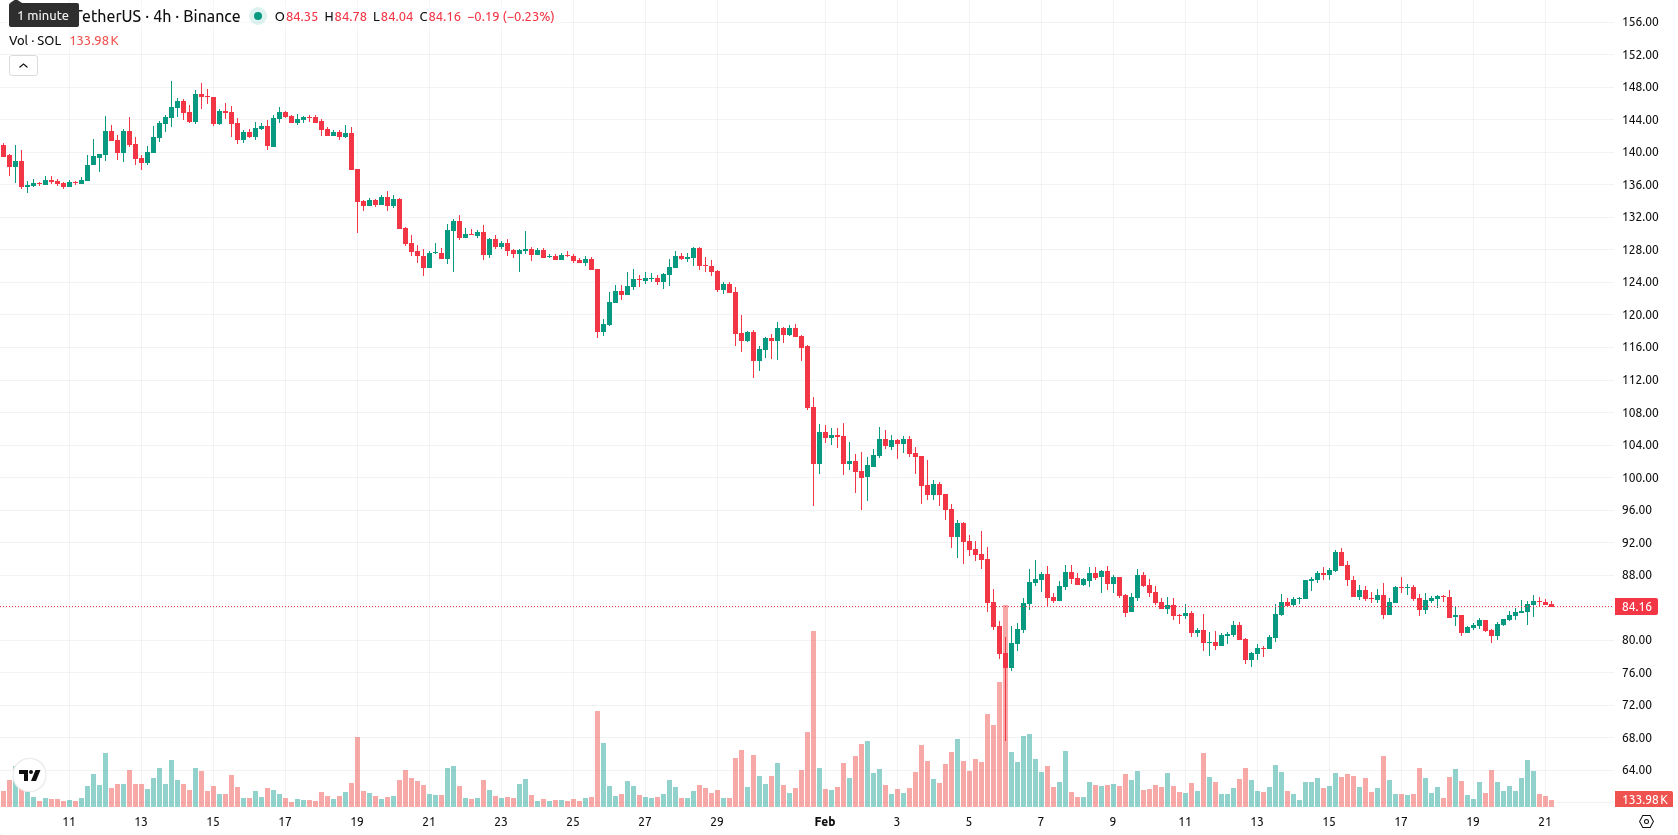
Solana (SOL) is trading at $84.13, representing a decrease for the week as it remains below key weekly moving averages: MA-20 at $87.09, MA-50 at $114.31, and MA-200 at $161.21. This confirms continued short-, medium-, and long-term bearish momentum on the weekly chart, with recent price action holding under all major dynamic resistance levels.
Highlights
- Solana (SOL) trades at $84.13, well below its MA-20 ($87.09), MA-50 ($114.31), and MA-200 ($161.21), confirming persistent bearish momentum across all timeframes.
- Bearish momentum prevails as MACD signals 'Strong Sell,' ADX is negative, and RSI (37.20) plus CCI (−42.76) move toward but not yet at oversold conditions.
- SOL faces nearest resistance at $87–$88.50 and potential support at $80, with a base-case forecast for consolidation and less than 20% probability price rises near term.
Ecosystem gains and ETF inflows support sentiment despite price weakness
Institutional interest in SOL persists, highlighted by $1.5 million in new capital flowing into the Bitwise Solana Staking ETF (BSOL) on February 19, 2026. The Solana ecosystem continues to demonstrate leading blockchain performance with over $3 million in 24-hour decentralized application revenue and daily DEX volume of more than $2.6 billion. Notable ecosystem developments include the launch of a tri-party custody model enabling institutions to earn staking rewards and borrow against staked SOL, as well as a non-custodial bridge for transferring wrapped Bitcoin between Ethereum and Solana.
Bearish momentum extends as SOL nears key resistance and oversold levels
On the weekly timeframe, SOL trades below its MA-20, MA-50, and MA-200, reflecting a sustained bearish trend. Key resistances are clustered near the Ichimoku Kijun level at $97.92 and the MA-20 around $87, while there is little dynamic support below the current price. Weekly RSI stands at 37.20 and CCI at −42.76, signaling a move toward oversold territory but not yet at extreme levels. MACD remains firmly bearish with a strong sell reading, and the ADX confirms dominant negative momentum, while the Awesome Oscillator shows a neutral bias, underscoring short-term technical conflict.
Sideways consolidation likely as weak signals cap bullish reversal potential
For the upcoming week, SOL is expected to consolidate in a range of $80.00 to $88.50, with sideways movement near recent lows as the dominant scenario. The probability of a sustained price increase is low, given the lack of weekly buy signals from the major indicators. Should price action break above the $87–$88.50 resistance, a bullish reversal could develop, but a downside move retesting support at $80 or below remains the more likely scenario if selling pressure intensifies.
Last time, analysts noted that Solana remains under sustained selling pressure, trading below key moving averages across all timeframes with technical indicators including MACD, ADX, and RSI signaling strong bearish momentum and emerging oversold conditions. Near-term, SOL is expected to stay range-bound with resistance at the Ichimoku Kijun limiting upside, while downside risks persist amid low bullish probability and heightened market stress.


Latest Solana News


-
 Afghanistan
-
 Albania
-
 Algeria
-
 Angola
-
 Argentina
-
 Armenia
-
 Australia
-
 Austria
-
 Azerbaijan
-
 Bahamas
-
 Bahrain
-
 Bangladesh
-
 Belarus
-
 Belgium
-
 Bolivia
-
 Botswana
-
 Brazil
-
 Brunei
-
 Bulgaria
-
 Cambodia
-
 Cameroon
-
 Canada
-
 Chile
Chile
-
 China
China
-
 Colombia
-
 Congo
Congo
-
 Costa Rica
-
 Cote d'Ivoire
-
 Croatia
-
 Cuba
Cuba
-
 Cyprus
-
 Czechia
-
 DR Congo
-
 Denmark
-
 Dominican Republic
-
 Ecuador
-
 Egypt
Egypt
-
 El Salvador
-
 Estonia
-
 Eswatini
-
 Ethiopia
-
 Finland
-
 France
-
 Georgia
-
 Germany
-
 Ghana
Ghana
-
 Greece
-
 Haiti
Haiti
-
 Hong Kong
-
 Hungary
-
 India
India
-
 Indonesia
-
 Iran, Islamic republic
-
 Iraq
Iraq
-
 Ireland
-
 Israel
-
 Italy
Italy
-
 Jamaica
-
 Japan
Japan
-
 Jordan
-
 Kazakhstan
-
 Kenya
Kenya
-
 Korea
Korea
-
 Kuwait
-
 Kyrgyzstan
-
 Laos
Laos
-
 Latvia
-
 Lebanon
-
 Lesotho
-
 Libya
Libya
-
 Lithuania
-
 Luxembourg
-
 Madagascar
-
 Malaysia
-
 Malta
Malta
-
 Mauritius
-
 Mexico
-
 Moldova
-
 Mongolia
-
 Montenegro
-
 Morocco
-
 Mozambique
-
 Myanmar
-
 Namibia
-
 Nepal
Nepal
-
 Netherlands
-
 New Zealand
-
 Nigeria
-
 North Macedonia
-
 Norway
-
 Oman
Oman
-
 Pakistan
-
 Palestine
-
 Panama
-
 Papua New Guinea
-
 Paraguay
-
 Peru
Peru
-
 Philippines
-
 Poland
-
 Portugal
-
 Puerto Rico
-
 Qatar
Qatar
-
 Reunion
-
 Romania
-
 Rwanda
-
 Saudi Arabia
-
 Serbia
-
 Singapore
-
 Slovakia
-
 Slovenia
-
 Somalia
-
 South Africa
-
 Spain
Spain
-
 Sri Lanka
-
 Sweden
-
 Switzerland
-
 Syria
Syria
-
 Taiwan
-
 Tajikistan
-
 Tanzania
-
 Thailand
-
 Trinidad and Tobago
-
 Tunisia
-
 Turkey
-
 UAE
UAE
-
 Uganda
-
 Ukraine
-
 United Kingdom
-
United States
-
 Uruguay
-
 Uzbekistan
-
 Venezuela
-
 Vietnam
-
 Yemen
Yemen
-
 Zambia
-
 Zimbabwe
- Forex
- Crypto
